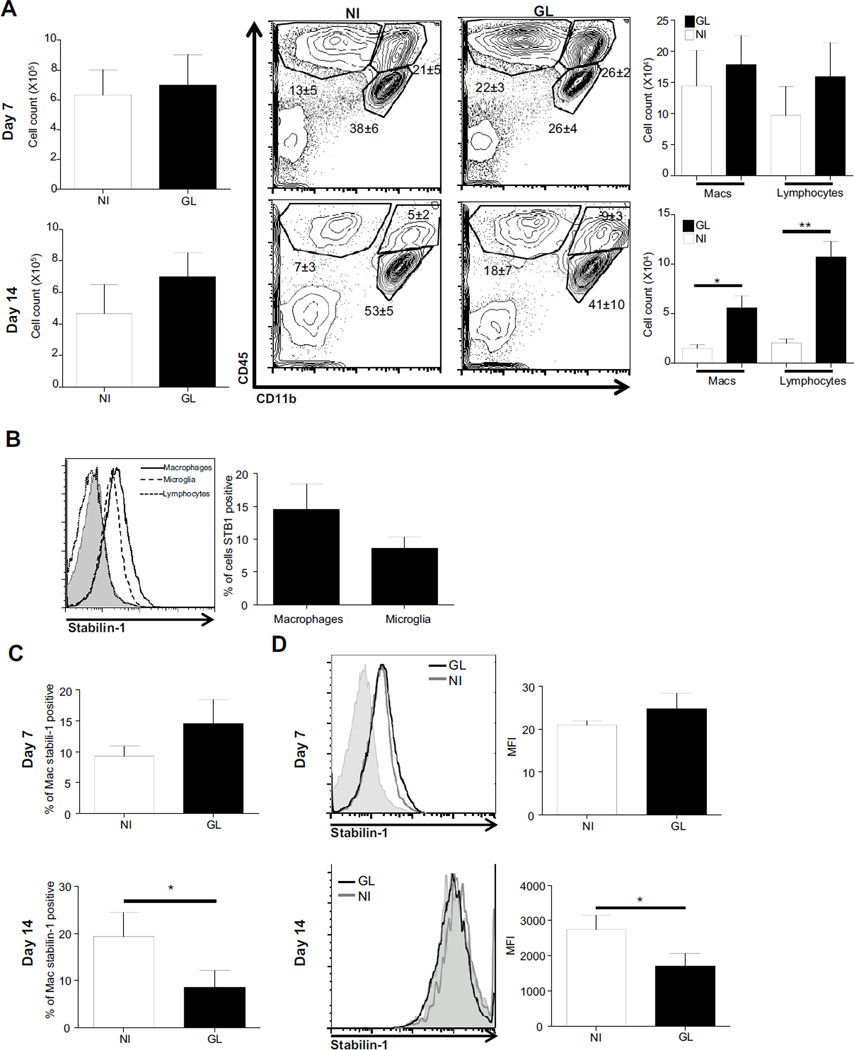
Figure 2. Stabilin-1 expression on macrophages.
Brain mononuclear cells were extracted, counted and stained for CD45 and CD11b allowing for differentiation of lymphocyte, macrophage and microglial populations (A). Cells were also stained for stabilin-1, and cells expressing stabilin-1 were identified (B). Proportion of total macrophages at day 7 and 14 post injection which are positive for stabilin-1 (C), and expression levels measured with mean fluorescent intensity for stabilin-1 at day 7 and day 14 post injection (D) were determined. NI: Non-injected hemisphere, GL: glioma injected hemisphere.

