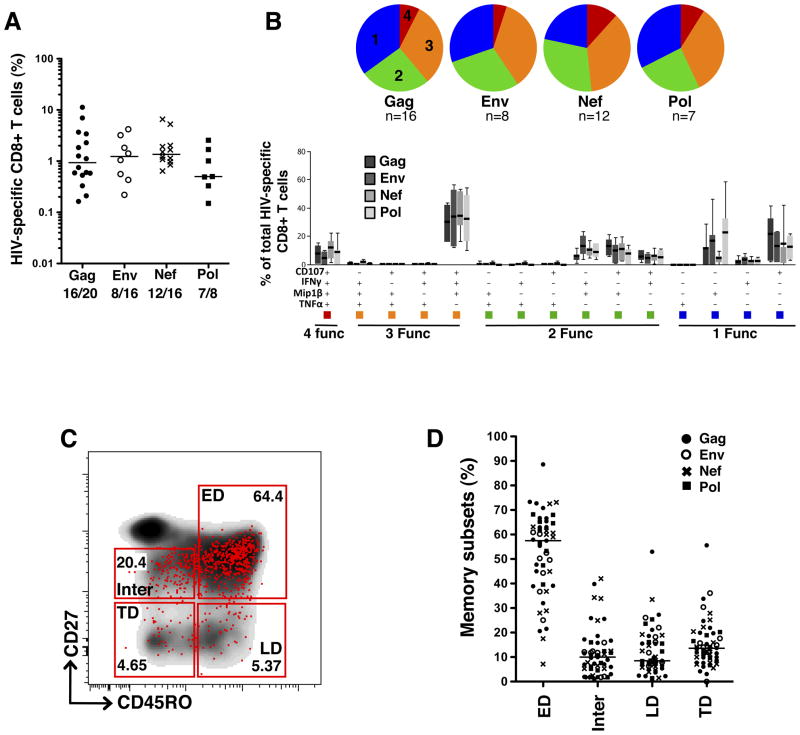
Figure 1. Polyfunctional and memory maturation profiles of HIV-specific CD8+ T cells.
(A) Magnitude of total cytokine production (CD107a, MIP1β, IFNγ or TNFα) in CD8+ T cells in response to HIV Gag, Env, Nef and Pol peptide pools. Results are expressed as % of total memory CD8+ T cells. Numbers correspond to the number of positive responses/number of tested individuals. (B) Polyfunctional profiles of HIV-specific CD8+ T cells. All possible combinations of four functions (CD107a, MIP1β, IFNγ and TNFα) produced by Gag, Env, Nef and Pol-specific CD8+ T cells are shown on the x-axis. Box and whiskers indicate the median percentage and range of the total response contributed by CD8+ T cells. Functional profiles are grouped and color-coded according to number of functions and summarized in the pie charts. Each slice of the pie corresponds to the median production of 4 (red), 3 (orange), 2 (green) or 1 (blue) function. (C) Representative dot plot of the memory maturation profile of total CD8+ T cells (density) and Gag-specific total cytokine+ CD8+ T cells (red dots) from one participant. ED: Early-differentiated memory cells (CD45RO+CD27+), LD: Late-differentiated memory cells (CD45RO+CD27−), Inter: Intermediate memory cells (CD45RO−CD27dim) and TD: Terminally-differentiated memory cells (CD45RO−CD27−). (D) Distribution of HIV-specific CD8+ T cells amongst memory subsets, showing 43 HIV-specific responses measured in 20 participants. Closed circles (●) correspond to Gag responses, open circles (○) represent Env responses, crosses (X) correspond to Nef responses and black squares (■) represent Pol responses. Horizontal lines indicate median values.

