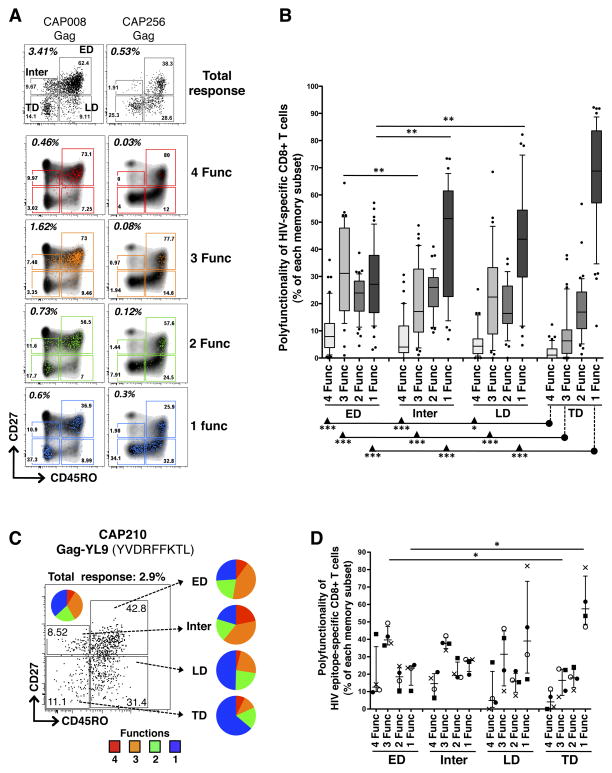
Figure 2. Polyfunctional profile of HIV-specific CD8+ T cells in defined memory subsets.
(A) Representative density and overlay dot plots of memory maturation in total CD8+ T cells (density) and Gag-specific CD8+ T cells endowed with 4 (red), 3 (orange), 2 (green) or 1 (blue) functions for two study individuals with a high and low Gag response. (B) Proportions of HIV-specific CD8+ T cells, exhibiting 4, 3, 2 or 1 functions, across distinct memory subsets. Responses to Gag, Env, Nef and Pol responses have been pooled (n=43 in 20 individuals). Results are shown as box and whisker (10–90 percentile) plots, with outliers depicted with black dots. (C) Representative example of memory profile of total Gag-YL9-specific CD8+ T cells (producing CD107a, MIP1β, IFNγ or TNFα). The pie chart inlaid within the dot plot corresponds to the polyfunctional profile of total Gag-YL9-specific CD8+ T cells. Adjacent pies represent the degree of polyfunctionality in Gag-YL9-specific CD8+ T cells according to their maturation phenotype. (D) Proportion of HIV-specific CD8+ T cells expressing 4, 3, 2 and 1 functions across distinct memory subsets (n=4 responses, in 3 individuals). Each symbol corresponds to an autologous peptide response. ●: Gag (YL9)-specific response in CAP210; ○ : Vif (WI9)-response in CAP210;X: Env (DV9)-specific response in CAP228 and ■: Nef (KF9)-specific response in CAP239. The median and interquartile ranges are shown for each group. The p-values were calculated using one-way ANOVA non-parametric Kruskal-Wallis test; ***: p<0.001, **: p<0.01, *: p<0.05.

