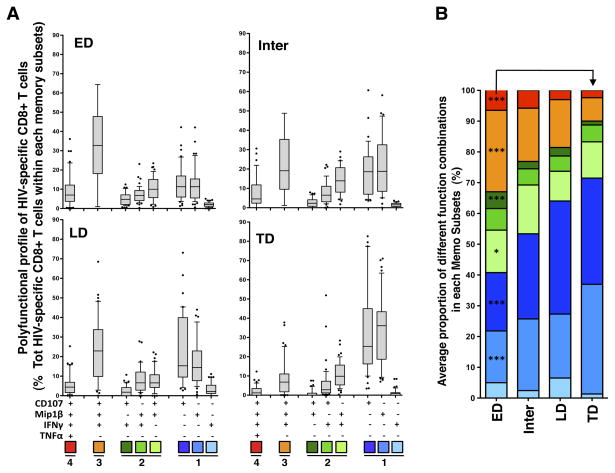
Figure 3. Cytokine combinations produced by HIV-specific CD8+ T cells in defined memory subsets.
(A) Proportion of HIV-specific CD8+ T cells producing eight distinct combinations of four functions, shown on the x-axis, across distinct memory subsets. Gag, Env, Nef and Pol responses have been pooled (n=43 in 20 individuals). Results are shown as box and whisker (10–90 percentile) plots, and outliers are depicted with black dots. (B) Mean production of different cytokine combinations in HIV-specific ED, Inter, LD and TD subsets. The p-values depicted on the graph correspond to the comparison between ED and TD subsets, and were calculated using a one-way ANOVA non-parametric Kruskal-Wallis test; ***: p<0.001, *: p<0.05.

