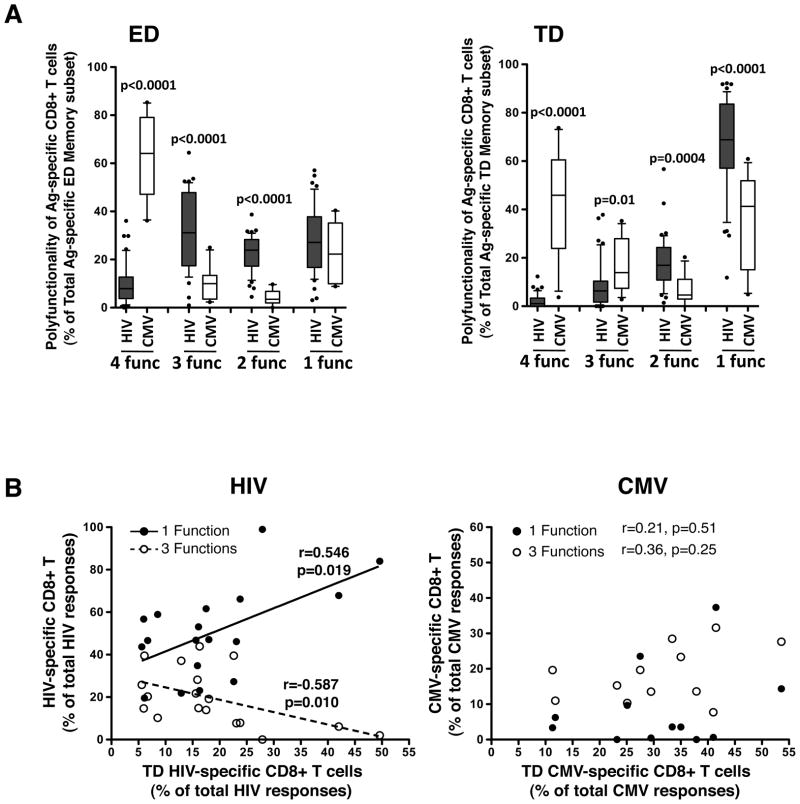
Figure 6. Comparison of the polyfunctional profiles of HIV− and CMV-specific CD8+ T cells in defined memory subsets.
(A) Proportion of HIV-specific (n=43 responses in 20 individuals) and CMV-specific (n=12) CD8+ T cells producing 4, 3, 2 and 1 function across different memory subsets (ED, Inter, LD and TD). Results are shown as box and whisker (10–90 percentile) plots, with outliers depicted with black dots. Statistical comparisons where determined by a Mann-Whitney non-parametric t-test. (B) Associations between the proportions of antigen-specific CD8+ T cells endowed with 1 or 3 functions (% of total antigen-specific CD8+ T cells) and the proportions of TD antigen-specific CD8+ T cells (% of total antigen-specific CD8+ T cells). HIV-specific responses are shown on the left (n=20 individuals) and CMV-specific responses (n=12) on the right. Statistical associations were performed by a two-tailed non-parametric Spearman rank correlation.

