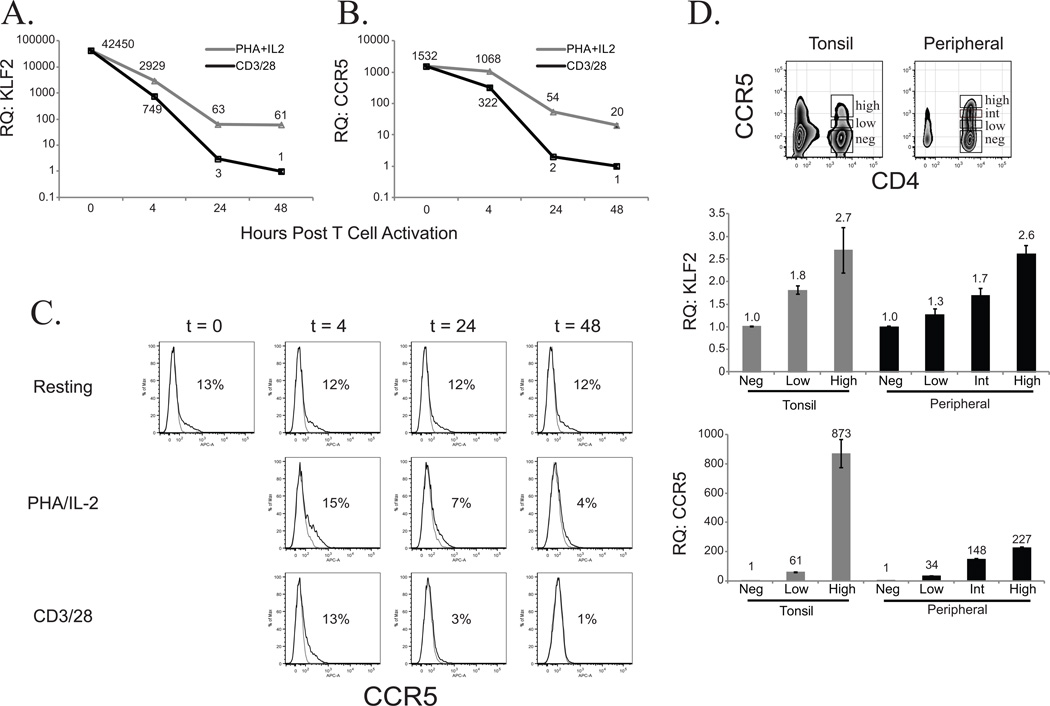
Figure 1. KLF2 and CCR5 expression are linked in primary human CD4 T cells.
Relative KLF2 (A.)and CCR5 (B.) expression levels were determined by real time RT-PCR using cDNA from resting CD4 T cells (T = 0 hrs), and at subsequent timepoints (T = 4, 24, 48 hrs) after PHA/IL2 activation or αCD3/CD28 coated bead costimulation. Expression levels were normalized to those in αCD3/CD28 stimulated CD4 T cells at assay endpoint (T = 48 hrs). C. FACS analysis of CCR5 expression on the cell surface in resting, PHA/IL2 or αCD3/CD28 stimulated CD4 T cells, relative to isotype control, during the first 48 hours after activation. D. CD4 T cells from tonsil or PBMC were FACS-sorted based on CCR5 expression, and their cDNAs were assayed by RT-PCR for relative KLF2 and CCR5 expression levels normalized to GAPDH.

