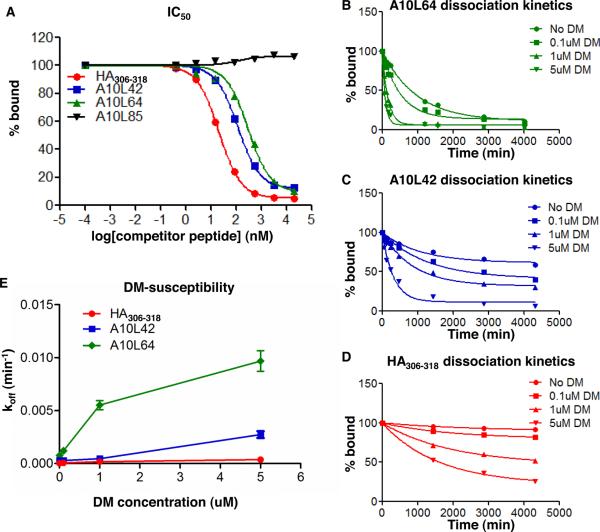
FIGURE 2. Different IC50, dissociation kinetics, and DM-susceptibilities of A10L peptides bound to HLA-DR1.
(A) Representative peptides with different IC50 to HLA-DR1. IC50 is reported as the 50% inhibition concentration calculated from the binding inhibition curve. (B–D) Representative peptides with different dissociation kinetics in the presence of various concentrations of DM. Dissociation half-lives in the absence of DM (intrinsic half-life) and in the presence of DM (DM-mediated half-life) were calculated from these dissociation curves. (E) koff versus DM concentration for representative peptides. The DM susceptibility is calculated as the slope of the koff versus DM concentration curve (using 0–1μM data only in cases where hyperbolic behavior was observed). The IC50 and dissociation kinetics for all A10L peptides were listed in Table II, with fixed DM concentration at 1uM for dissociation kinetics. These data represent three independent experiments with two replicates each.

