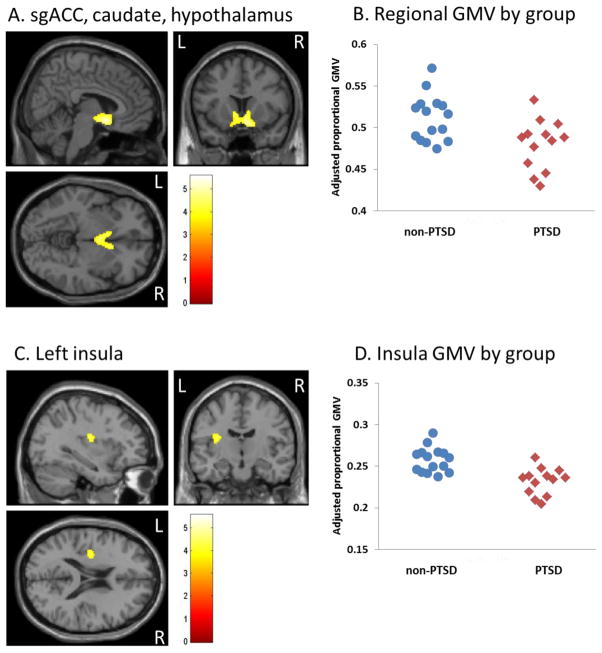
Figure 3.
Subjects with PTSD exhibit smaller sgACC, caudate, hypothalamus, and left insula GMV compared to non-PTSD. (A) sgACC, caudate, hypothalamus. (B) Scatterplot depicting individual sgACC/caudate/hypothalamus regional GMVs by diagnostic group. (C) Left insula. (D) Scatterplot depicting individual left insula regional GMVs by diagnostic group. Scatterplots depict proportional GMV values averaged over all voxels in the cluster, and adjusted for total GMV. Extracted values shown here are not adjusted for depression scores or age.

