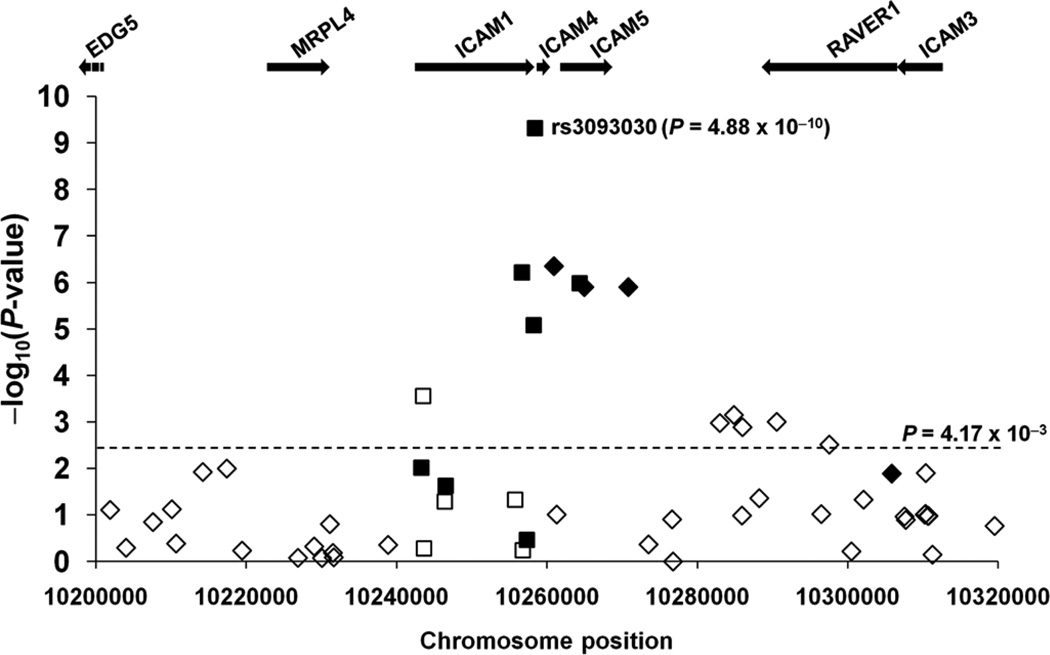
Figure 1.
A systemic lupus erythematosus association map for the genotyped (squares) and imputed single-nucleotide polymorphisms (SNPs) (diamonds) within and around the ICAM1–ICAM4–ICAM5 locus. Negative logarithms (base 10) of the p values calculated from the meta-analysis (y axis) are plotted against SNP positions on human chromosome 19 (x axis). The direction of effect size was the same in all four ancestries for some SNPs (filled symbols) but not for others (empty symbols). The arrows indicate transcription directions and gene sizes.

