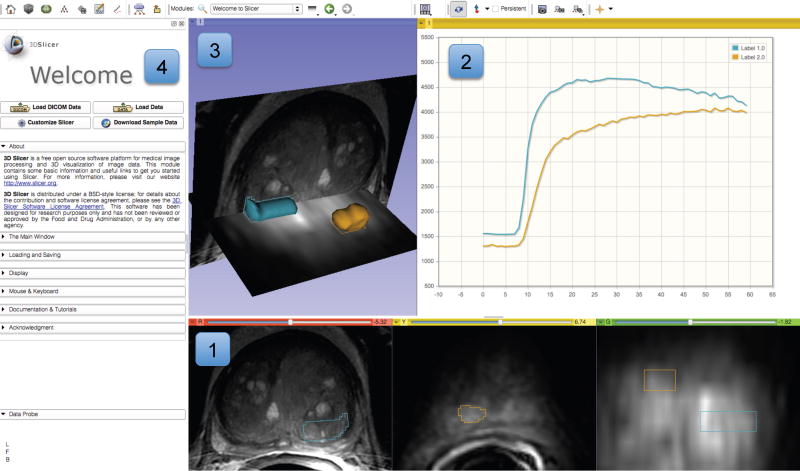
Figure 2.
Experimental visualization of dynamic contrast enhancement (DCE) MRI of the prostate demonstrating various visualization capabilities of 3D Slicer. Slice viewers (annotated as “1”) show an axial cross-section of T2w image, and a single frame of a DCE series in axial and coronal cross-sections. Contours of the segmented areas corresponding to normal-appearing and tumor-suspected areas appear in colored overlay. Chart viewer shows the mean change in signal intensity during DCE imaging for the contoured areas (annotated as “2”), while the 3D viewer (annotated as “3”) brings cross-sections and segmented areas (represented by triangulated surfaces) into 3D context. Panel on the left shows the GUI of the Slicer Welcome module (annotated as “4”).

