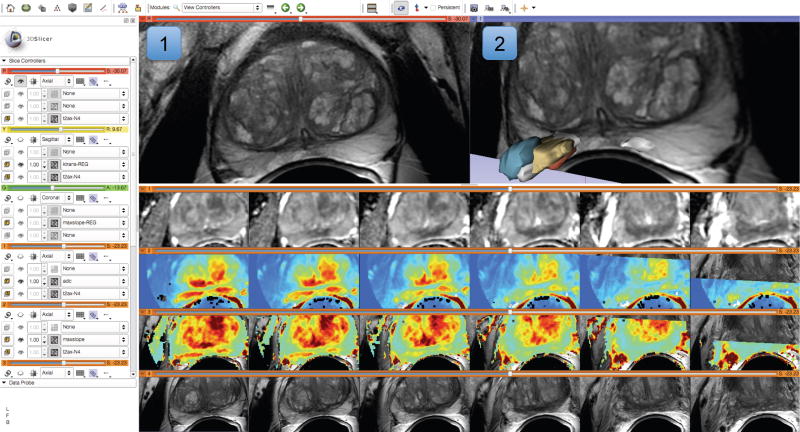
Figure 4.
Visualization capabilities and Slicer user interface are utilized for exploration of the multiparametric MRI of the prostate. The T2-weighted (T2w) MR scans (top left image and the bottom row of consecutive slices) provide anatomical detail and context for interpretation of the registered Apparent Diffusion Coefficient (ADC) map (first row of the image matrix) calculated from the Diffusion Weighted MRI (DWI) and various pharmacokinetic maps computed from dynamic contrast enhanced (DCE) MRI, as shown in the 2D axial slice viewer (marked by “1”) and the Compare View layout below. Spatial context of the annotated tumor ROI is provided by composed view of the tumor ROI surface and the T2w image cross-section in the 3D viewer (marked by “2”).

