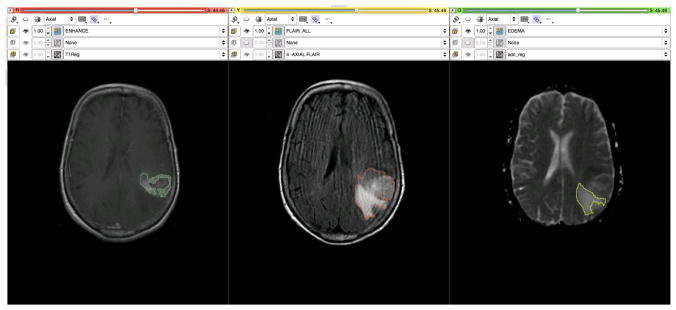
Figure 6.
T1, FLAIR and ADC maps are registered and segmented using the grow-cut segmentation module in Slicer. In the left pane, the enhancing region is delineated on a post-contrast T1 image, while in the center the region of FLAIR abnormality is identified. In the right pane a region of vasogenic edema is outlined on the ADC map derived from the DWI images.

