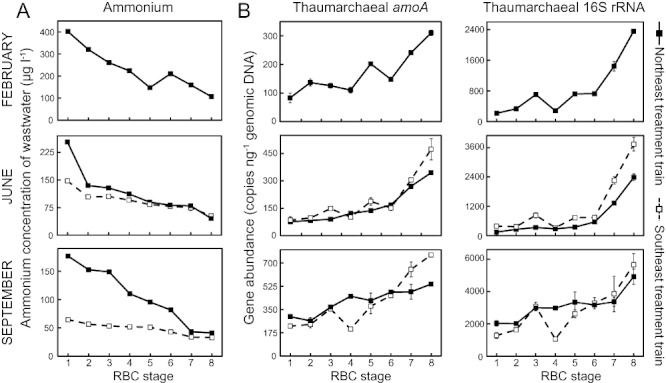
Fig. 2.

Ammonium concentrations of wastewater (A) and thaumarchaeal amoA and 16S rRNA gene abundances in associated biofilm samples (B) across RBC flowpaths. Error bars represent standard deviations based on technical duplicates; error bars that are not seen are contained within the symbols, except for ammonium concentrations in the February NE treatment train, for which duplicate measurements are not available.
