
Figure 2.
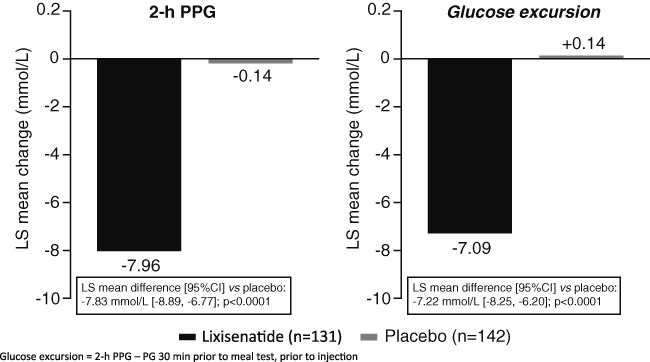
Changes in post-meal glucose parameters from baseline after 24 weeks. Change in LS mean (±s.e.) 2-h postprandial plasma glucose (PPG) levels and change in LS mean (±s.e.) 2-h glucose excursion (2-h PPG – plasma glucose 30 min prior to meal test, prior to injection). LOCF data. mITT population.