
Figure 2.
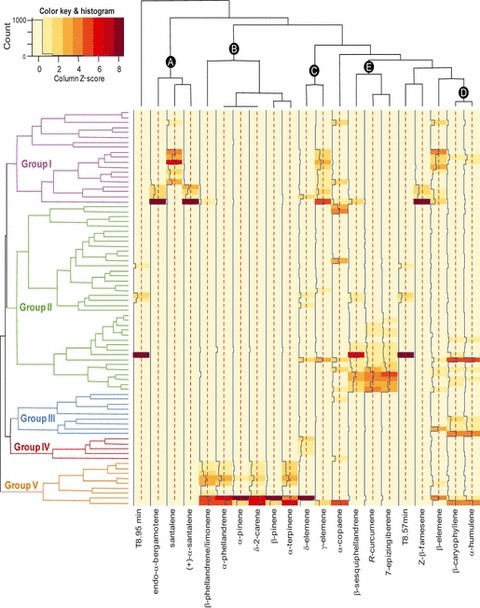
Two-way cluster analysis of normalized peak areas from S. habrochaites accessions. The peak areas normalized to the internal standard and leaf dry weight were calculated for each of the 21 terpene signals in 79 S. habrochaites accessions and M82. The average from two to three replicates was calculated and used for construction of the heatmap. Each row represents the average terpene composition for an accession, and the dendrogram on the left represents the clustering of accessions based on chemical profile. Accessions from the same group (I through V) have similar terpenes. Each column represents the abundance of a particular terpene in all accessions, and the dendrogram representing the clustering of terpenes based on presence/absence in the accessions is shown at the top. Terpenes from the same module (A through E) show similar patterns of accumulation across accessions. Clustering was performed as described in Experimental procedures. The distance of the blue trace line from the center of each cell (red dotted line) is proportional to the abundance of the compound. The peak areas were centered in the column direction. T 8.57 min and T 8.95 min represent unidentified terpenes eluting at 8.57 and 8.95 min, respectively. The order of the accessions in the dendrogram is the same as those presented in Figure 1.