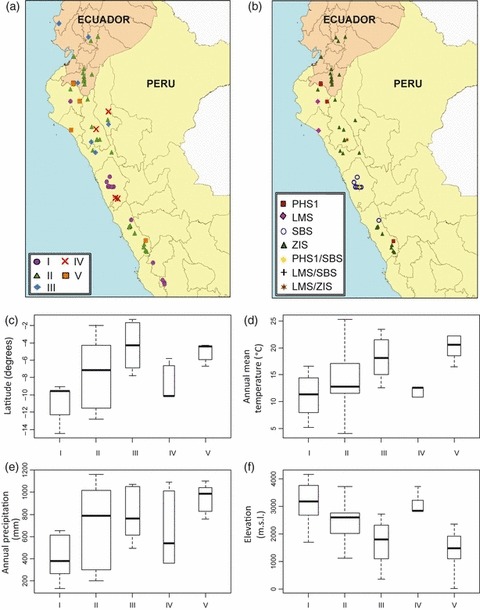
Figure 7.

Geographical distribution of S. habrochaites accessions and climatic data. (a, b) Map of Ecuador and Peru showing the collection coordinates of S. habrochaites accessions. (a) Accessions were classified according to the chemical groups determined by hierarchical clustering (Figure 2). (b) Accessions were classified based TPS-e/f derived terpenes. (c–f) Box plots displaying differences between chemical groups in climate data of collection sites. The box plots show lower and upper quartiles, the extreme values that are not outliers and the median. Outliers have been omitted. Boxes are drawn with widths proportional to the square-roots of the number of observations in the group. Maps and climate data were obtained in DIVA-GIS. Box plots were constructed using R.
