Fig. 2.

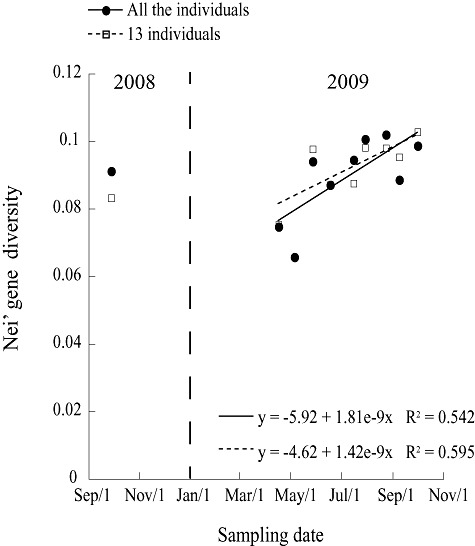
Nei's gene diversity over time, in 2008 and during 2009 bloom of G. semen, with all the individuals (circles with full line) and the data set including 13 individuals per sampling date (squares with the dotted line).

Nei's gene diversity over time, in 2008 and during 2009 bloom of G. semen, with all the individuals (circles with full line) and the data set including 13 individuals per sampling date (squares with the dotted line).