Fig. 3.

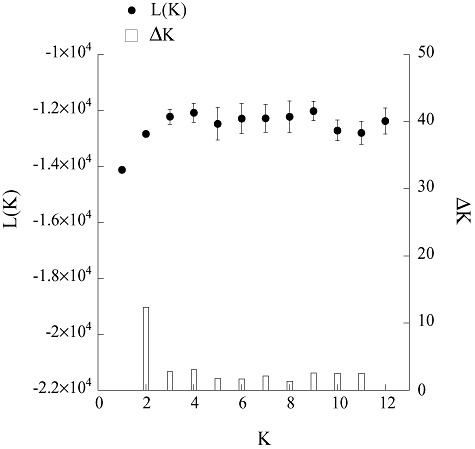
Summary of the results from the STRUCTURE analysis using the no-admixture ancestry model allowing for independent frequencies, L(K) (black dots) and ΔK (bars) for the different K population assumptions.

Summary of the results from the STRUCTURE analysis using the no-admixture ancestry model allowing for independent frequencies, L(K) (black dots) and ΔK (bars) for the different K population assumptions.