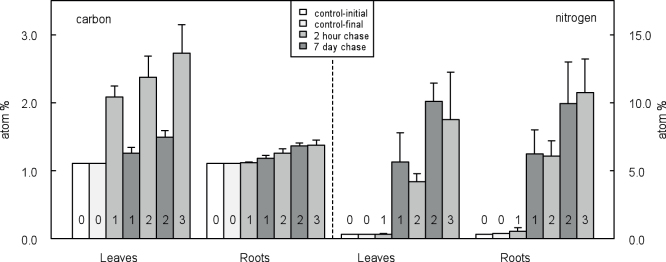
Figure 1. Atom percent concentration of 13C and 15N in seedling leaves and roots at different pulse and chase times.
Chase time of control, 2 hour or 7 day is indicated by shading in the box. The number of pulses (0–3) is indicated by a number at the base of the barplot. Error bars represent one standard deviation (n = 6).

