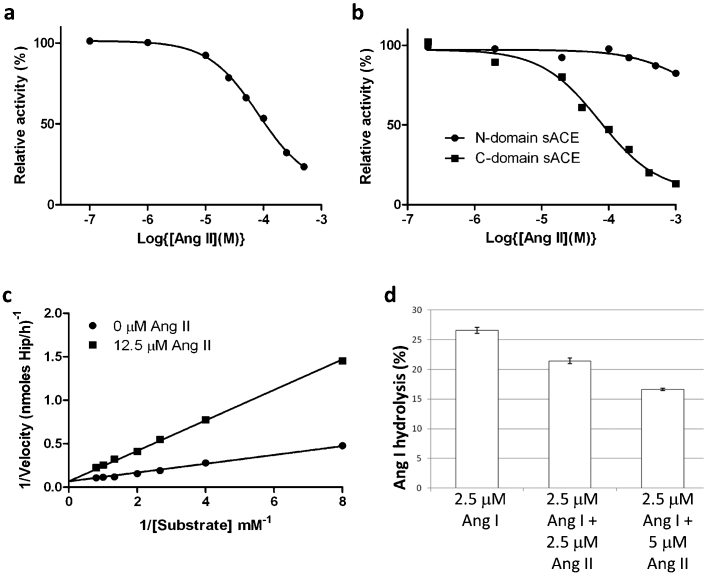
Figure 3.
(a) Inhibition of human sACE by Ang II.Serum was used as the source of soluble sACE. ACE activity was assayed using HHL as substrate in presence of various concentrations of Ang II as described in the Methods. Data is expressed as a percentage of uninhibited activity and each data point is the mean of three replicates. A Hill slope of 1 was obtained using GraphPad© , which is consistent with simple linear competitive inhibition. (b) Inhibition of human N- and C-domain ACE by Ang II. ACE activity of recombinant N-domain and C-domain was determined using HHL as substrate in presence of various concentrations of Ang II as described in the Supplementary material. Data is expressed as a percentage of uninhibited activity and each data point is the mean of three replicates. A Hill slope of 1 for the inhibition of C-domain ACE was obtained using GraphPad© , which is consistent with simple linear competitive inhibition. (c) Lineweaver-Burk plot showing the competitive nature of the inhibition by Ang II of the hydrolysis of HHL by C-domain ACE. (d) Ang II inhibits Ang I conversion by human sACE. The impact of Ang II (2.5 and 5 µM) on the conversion of Ang I (2.5 µM) to Ang II by human sACE (serum) was determined by quantifying the decline in Ang I using HPLC. The results are expressed as % hydrolysis and are the means ± SEM (n = 4). HPLC analysis showed that Ang II was metabolically stable in serum under the same conditions as used for the inhibitor studies.

