
Figure 1.
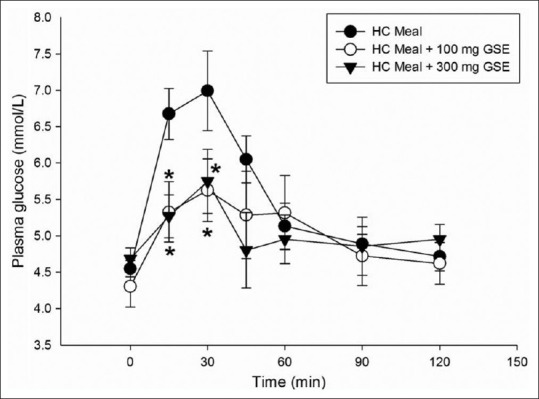
Plasma glucose concentration of high carbohydrate meal (•), HC meal + 100 mg GSE (∘), HC meal + 300 mg GSE (▼) in healthy participants (n=8). Values are means with standard error of the means represented by vertical bars. Mean value was significantly different from that of a HC meal: *P < 0.05