
Figure 3.
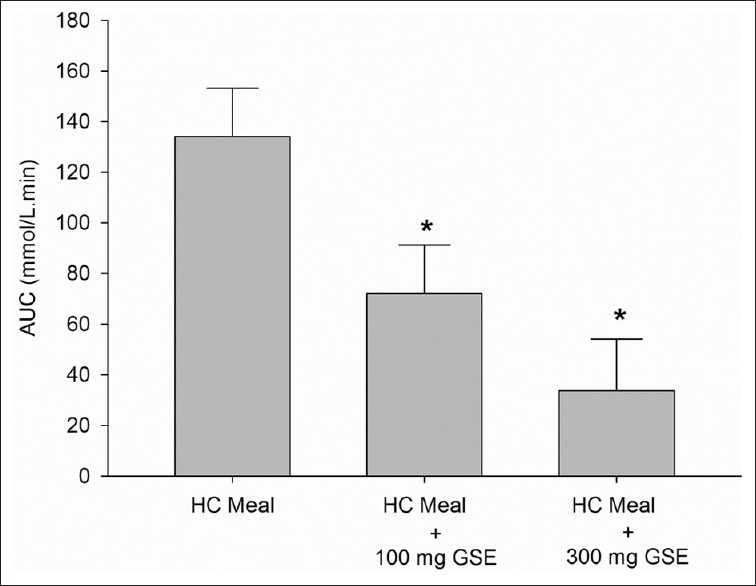
Area Under the Curve (AUC) of plasma glucose concentration (mmol/L) of high carbohydrate (HC) meal and HC meal + GSE (100 and 300 mg) in healthy participants (n=8). Value was significantly different from that of a HC meal: *P < 0.05
Official websites use .gov
A
.gov website belongs to an official
government organization in the United States.
Secure .gov websites use HTTPS
A lock (
) or https:// means you've safely
connected to the .gov website. Share sensitive
information only on official, secure websites.
Area Under the Curve (AUC) of plasma glucose concentration (mmol/L) of high carbohydrate (HC) meal and HC meal + GSE (100 and 300 mg) in healthy participants (n=8). Value was significantly different from that of a HC meal: *P < 0.05