
Table 2.
The association of subcortical infarct, cortical infarct, and relative hippocampal volume with cognitive functioning in 4 domains, controlling for total brain atrophy (i.e., relative brain volume) and demographic variables (separate models were run for each cognitive outcome; variables in the left column are the model predictors; values reported are unstandardized β weights [SE]) (top) and the same models rerun to include additional vascular disease covariates (bottom)
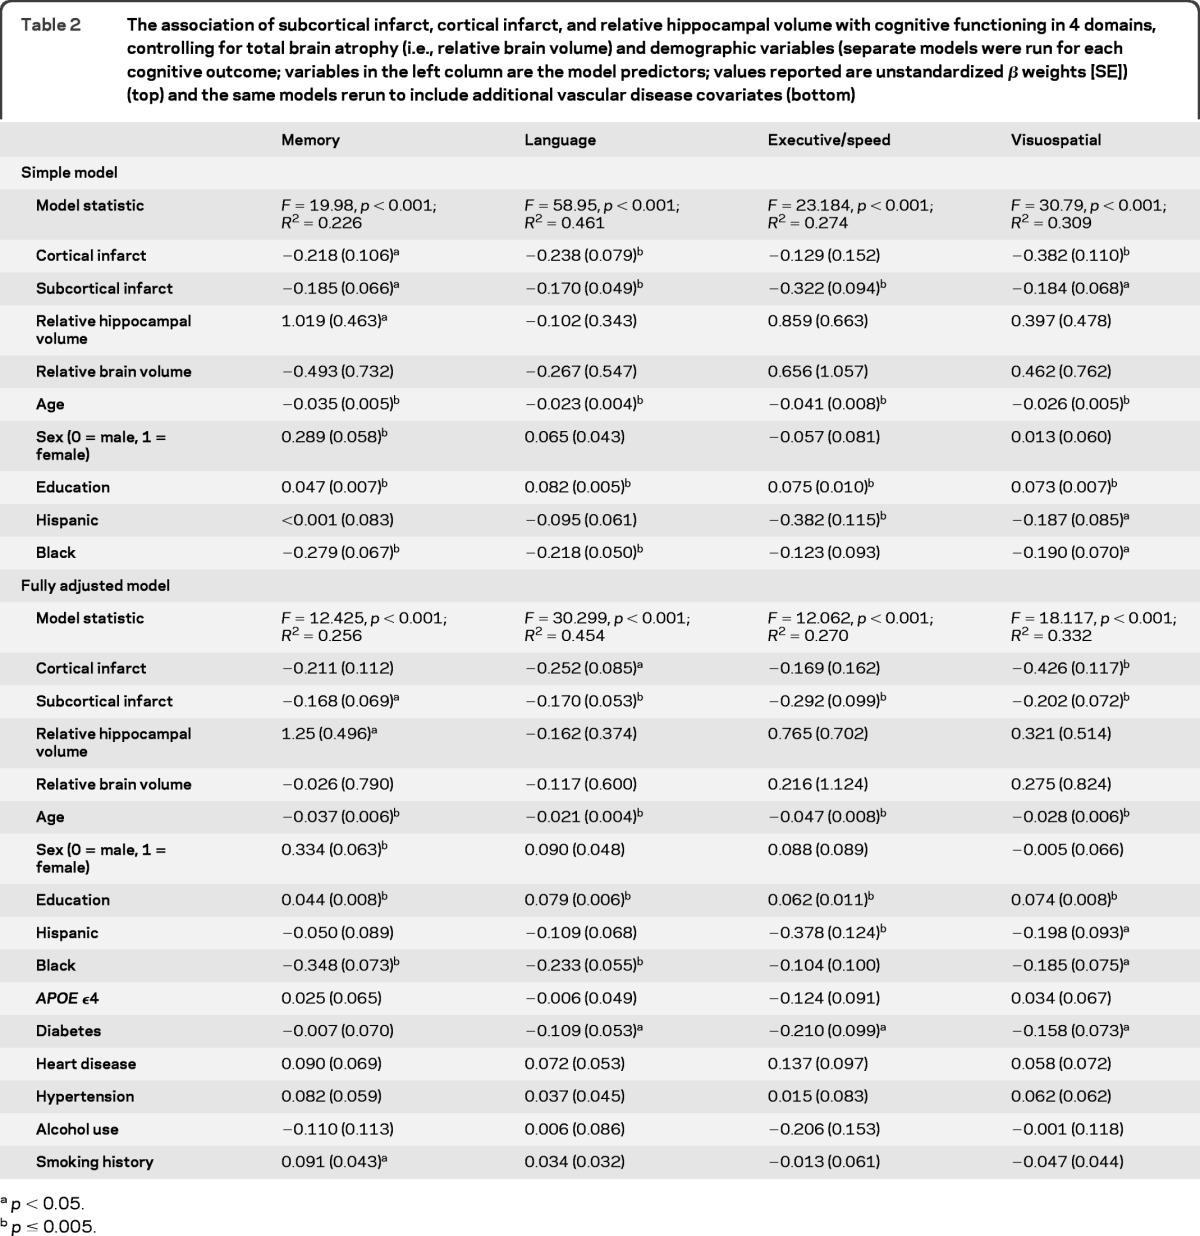
a
p < 0.05.
b
p ≤ 0.005.