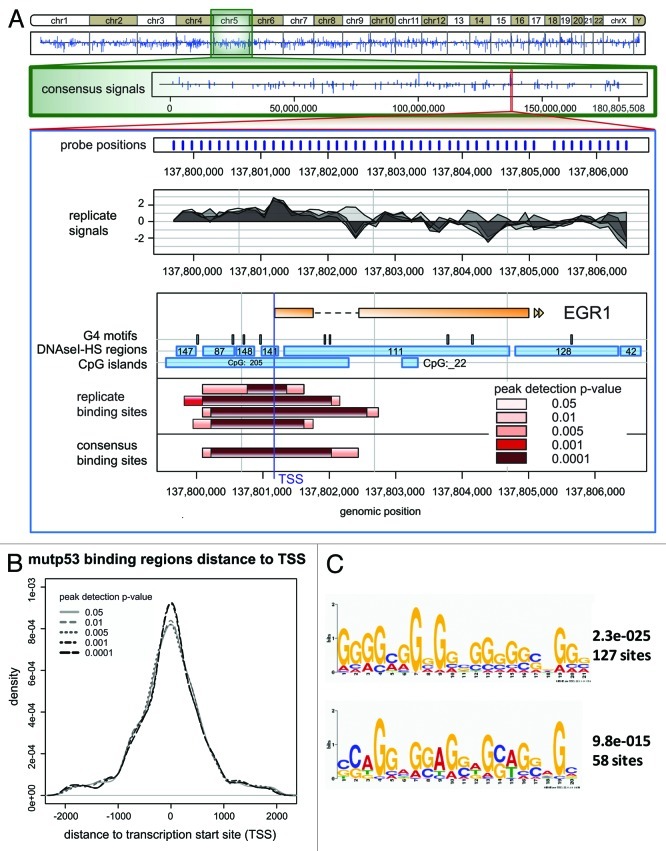
Figure 1. Array-wide analysis of mutp53 binding sites. (A) Consensus signals for the whole genome and for chromosome 5 are shown. The EGR1 gene is shown as an example of a known mutp53 target gene. The lower panel displays the detected peaks in the EGR1 gene dependent on the selected p value threshold during peak calling. CpG-islands, DNaseI-HS regions and G4 motif locations extracted from the public databases are plotted. (B) Distribution of mutp53-BR around TSS. The median length of mutp53-BR varied from 1270 bp to 990 bp. (C) Motifs overrepresented in mutp53 binding regions (p value 0.001) identified by MEME-ChIP analysis.

An official website of the United States government
Here's how you know
Official websites use .gov
A
.gov website belongs to an official
government organization in the United States.
Secure .gov websites use HTTPS
A lock (
) or https:// means you've safely
connected to the .gov website. Share sensitive
information only on official, secure websites.
