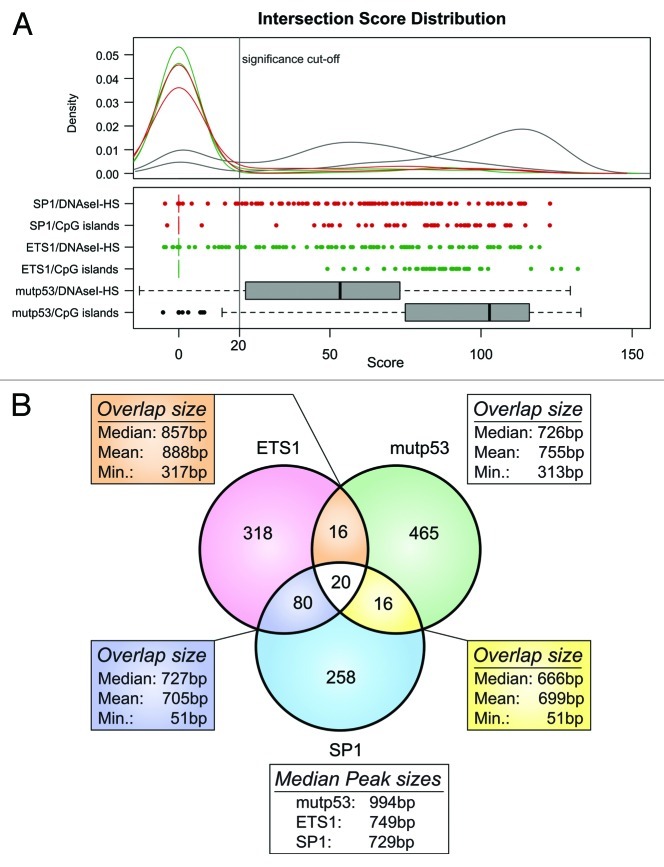
Figure 3. Array-wide analysis of mutp53, SP1 and ETS1 binding sites. (A) Distribution of the scores calculated for the overlap of mutp53, ETS1 and SP1 binding regions with CpG-islands and DNaseI-HS regions. The distribution was used to identify a significance threshold, where peaks with a score > = 20 are assumed to overlap significantly. (B) Venn-diagram displaying the number of overlapping mutp53, ETS1 and SP1 binding regions.

An official website of the United States government
Here's how you know
Official websites use .gov
A
.gov website belongs to an official
government organization in the United States.
Secure .gov websites use HTTPS
A lock (
) or https:// means you've safely
connected to the .gov website. Share sensitive
information only on official, secure websites.
