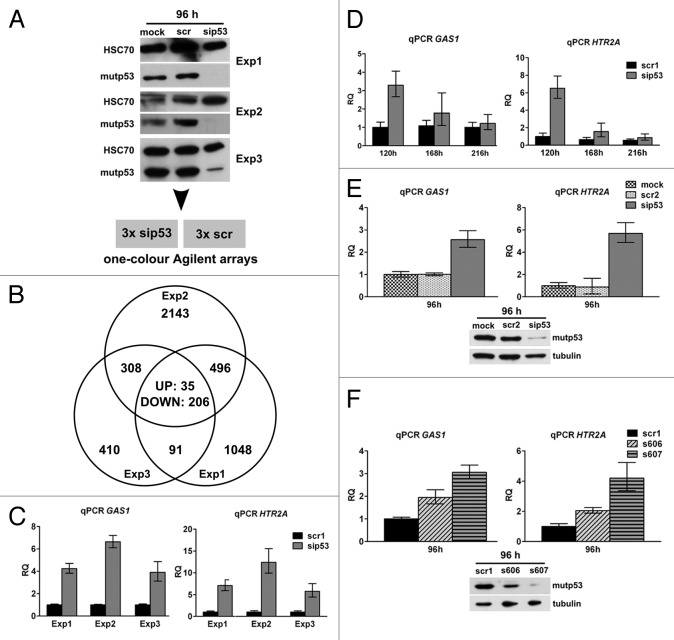
Figure 4. Expression analysis in U251 cells after mutp53 depletion. (A) U251 cells were transfected with p53- and scr-siRNA in three biological replicates and mutp53 protein was detected 96 h post-transfection by WB. HSC70 was used as a loading control. (B) Total RNA from three replicate transfections with p53- and scr-siRNA was subjected to microarray gene expression analysis. The Venn diagram shows the number of probes regulated in three experiments. (C) Transcript levels of GAS1 and HTR2A genes after mutp53-depletion were measured relative to the scr-control (scr1) in the same samples that had been subjected to microarray analysis. (D) Transcript levels of GAS1 and HTR2A genes were measured in a time-course experiment after mutp53-depletion until re-expression of mutp53 occurred (for WB, see Fig. S6B). (E and F) Transcript levels of GAS1 and HTR2A genes were measured 96 h after mutp53 depletion in two additional experiments including mock transfections and a different scr-siRNA (scr2; E) as well as two different p53-siRNAs (s606, s607) (F). WB analysis of mutp53 expression in transfected cells is shown below the graphs. Tubulin was used as a loading control.

An official website of the United States government
Here's how you know
Official websites use .gov
A
.gov website belongs to an official
government organization in the United States.
Secure .gov websites use HTTPS
A lock (
) or https:// means you've safely
connected to the .gov website. Share sensitive
information only on official, secure websites.
