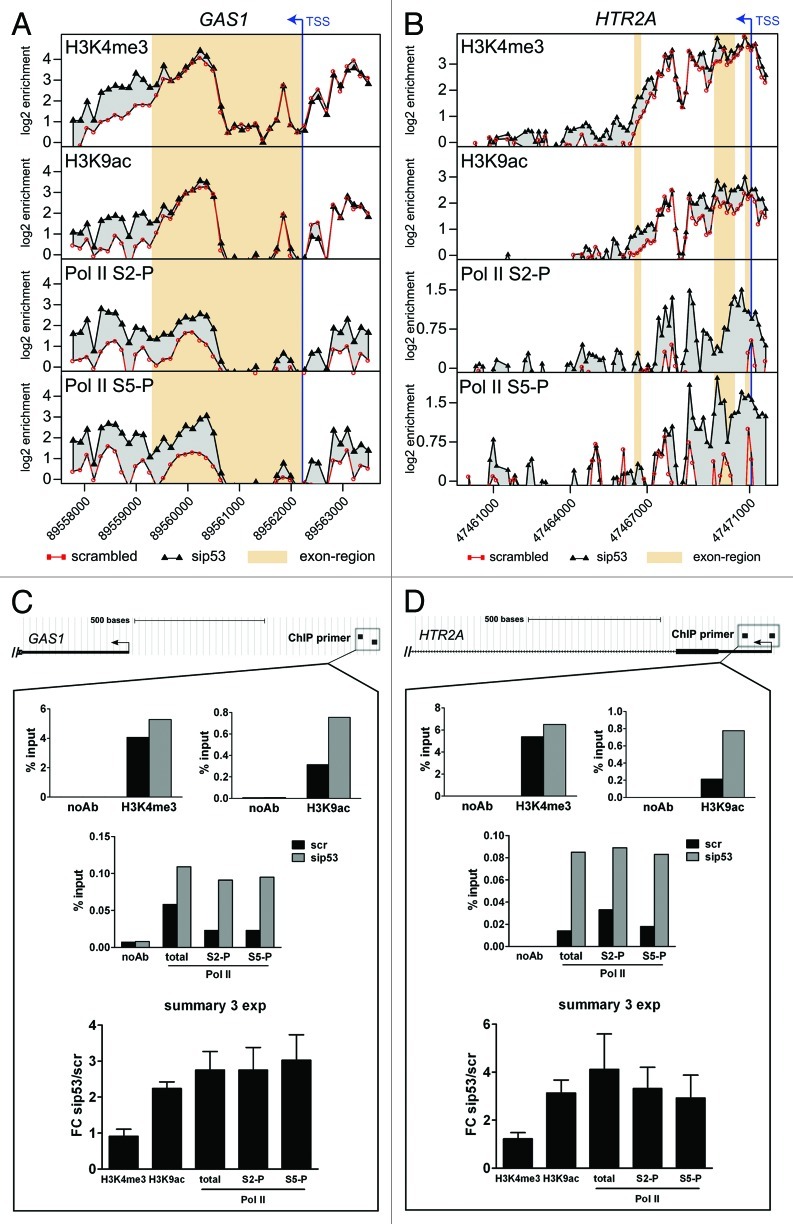
Figure 7. (A, B) ChIP-chip profiles of H3K4me3, H3K9ac, Pol II S2-P and Pol II S5-P occupancy in the GAS1 (A) and the HTR2A (B) genes in scr- and sip53-transfected U251 cells. Mean log2-values of the signal ratio “ChIP-sample/input” for every probe on the tiling array from two biological replicates are plotted against the probe position. The transcription start site (TSS) is marked by an arrow and exons are highlighted. (C, D) A qPCR-based analysis of a representative experiment for the promoter regions of GAS1 (C) and HTR2A (D). Data for scr- and p53-siRNA-transfected cells are presented as percent recovery of input DNA by the specific antibodies. A control without addition of antibodies is shown. The results of the three replicate experiments are summarized as fold change of mutp53-depleted cells vs. control cells.

An official website of the United States government
Here's how you know
Official websites use .gov
A
.gov website belongs to an official
government organization in the United States.
Secure .gov websites use HTTPS
A lock (
) or https:// means you've safely
connected to the .gov website. Share sensitive
information only on official, secure websites.
