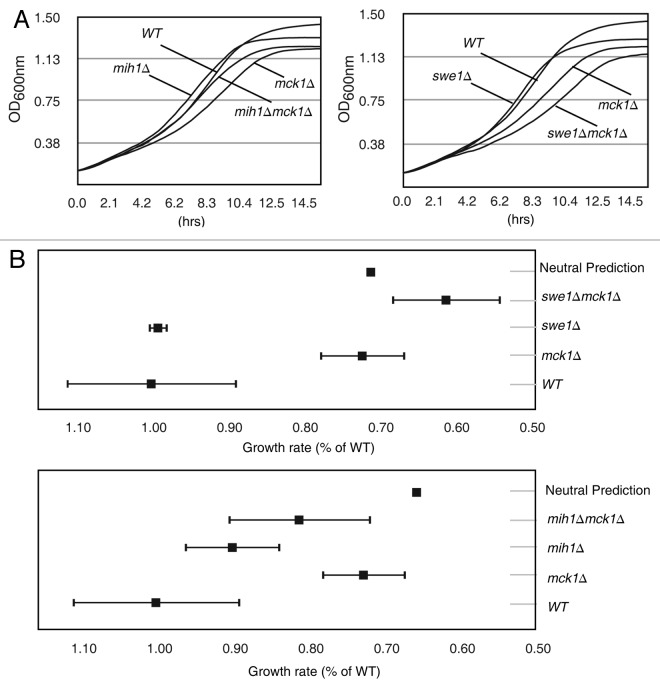
Figure 2. The slow growth rate of mck1∆ strains is ameliorated by mih1∆ and exacerbated by swe1∆. (A) The indicated strains were grown in a 96-well plate, and OD600nm measurements were taken every 20.8 min. The average of eight replicate growth curves per strain is plotted. (B) Growth rates relative to WT are plotted with standard deviation. Neutral prediction indicates no genetic interaction. Error bars represent standard deviation. Error bars for neutral predication are too small to observe.

An official website of the United States government
Here's how you know
Official websites use .gov
A
.gov website belongs to an official
government organization in the United States.
Secure .gov websites use HTTPS
A lock (
) or https:// means you've safely
connected to the .gov website. Share sensitive
information only on official, secure websites.
