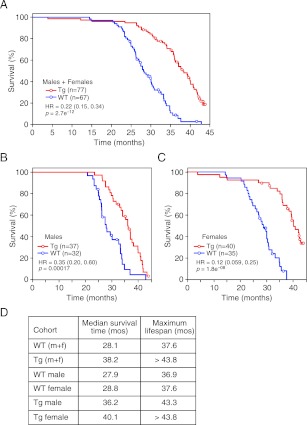
Figure 3. FGF21 extends lifespan.
(A–C) Kaplan–Meyer survival curves for wild-type (WT) and FGF21-transgenic (Tg) mice are shown. (A) Combined male and female data; (B) male data; (C) female data. (D) Median survival time (at 50th percentile) and maximum lifespan (at 95th percentile) for each cohort. Hazard ratios (HR) and 95% confidence intervals are shown for Tg vs WT mice.

