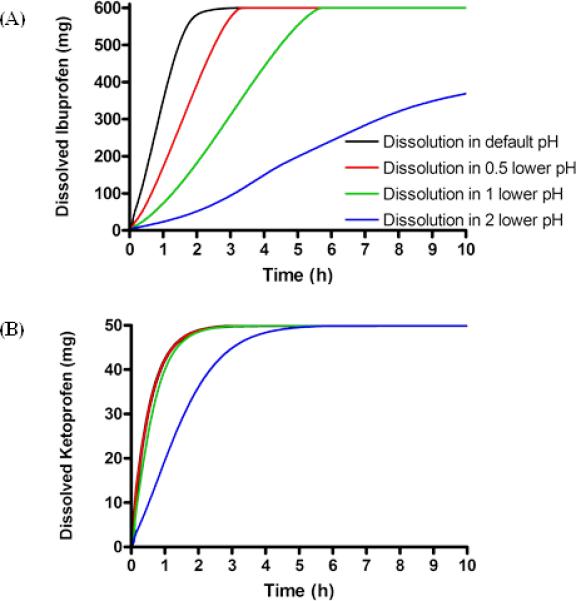
Figure 1. The delayed dissolution rates of an IR dosage from to the lowered pH of GI tract used in the simulations.

A) ibuprofen and B) ketoprofen. Black line represents the drug dissolution of an IR dosage form in default pH at the small intestine, red line represents the drug dissolution of an IR dosage form in half point lower pH at the small intestine, green line represents the drug dissolution of an IR dosage form in 1point lower pH at the small intestine, blue line the drug dissolution of an IR dosage form in 2 point lower pH at the small intestine.
