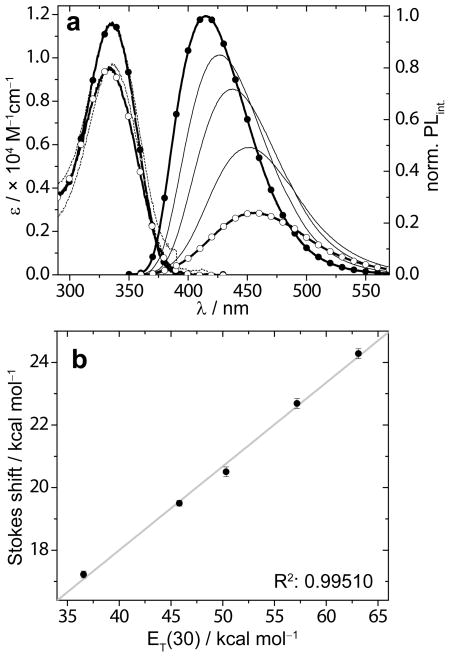
Figure 1.
a) Absorption (dashed line) and emission (solid line) spectra of 1a in dioxane (bold black line, solid circles), water (bold black line, open circles), and binary mixtures of 10, 30, and 70 v% water in dioxane (black lines). Samples’ concentration is 7.9 × 10⁻⁶ M, emission is recorded after excitation at 335 nm. b) A plot of the Stokes shift (in kcal/mol) vs. ET(30) values (in kcal/mol) obtained from dioxane–water mixtures (data points with error bars) and linearization (grey line). Absorption and emission spectra of each sample are recorded in duplicate; only one set is shown.

