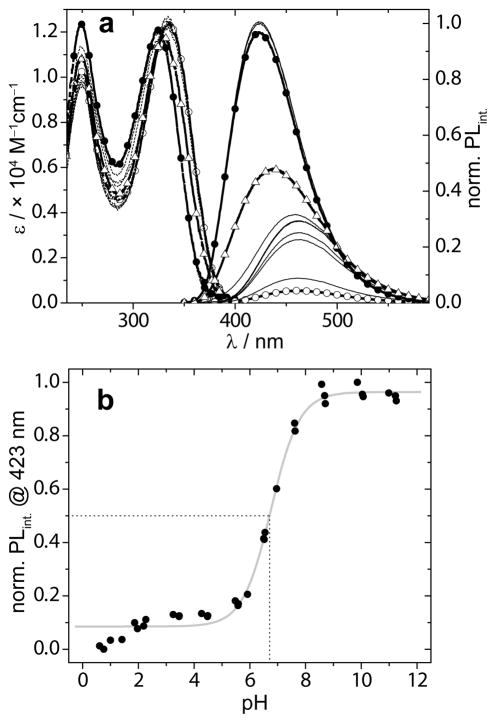
Figure 2.
a) Absorption (dashed lines) and emission plots (solid lines), corrected for small differences in the O.D. at the λex(335 nm) of 1a at pH 0.61 (open circles), pH 10.99 (solid circles), pH 6.55 (open triangles) and intermediate pH values (black lines). b) Plot of the normalized emission intensity as function of sample pH (solid circles) fitted to a sigmoidal curve (grey line). The dashed lines illustrate a graphical determination of the pKa value.

