Figure 3.

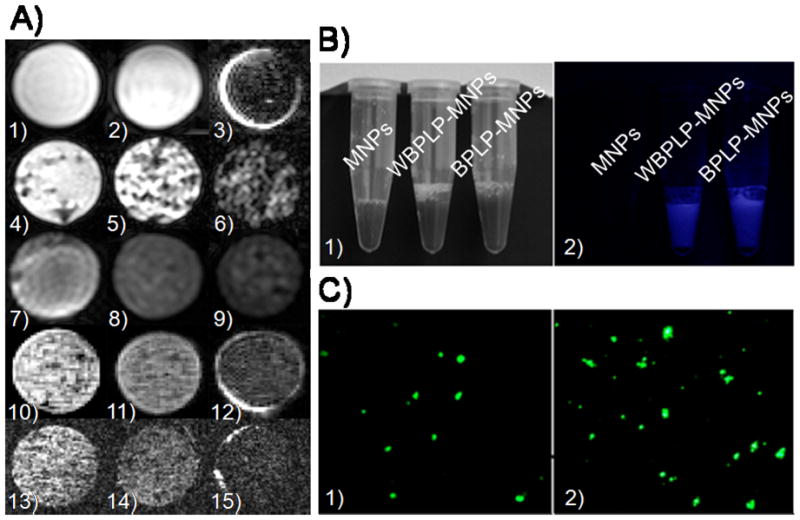
(A) MR images of agarose phantoms containing (1) 5 mg ml−1 BPLP nanoparticles, (2) 104 PC3 cells, and (3) 0.1 mg ml−1 MNPs as control samples. Experimental agarose phantoms contain (4) WBPLP-MNPs of 0.1 mg ml−1, (5) 0.3 mg ml−1, and (6) 0.6 mg ml−1 concentrations; (7) 0.3 mg ml−1 WBPLP-MNPs uptaken by 104, (8) 106, and (9) 5×10⁶ PC3 cells; similarly (10) BPLP-MNPs of 0.1 mg ml−1, (11) 0.3 mg ml−1, and (12) 0.6 mg ml−1 concentrations; and (13) 0.3 mg ml−1 BPLP-MNPs uptaken by 104, (14) 106, and (15) 5×10⁶ PC3 cells. (B) Photographs of nanoparticles suspensions in (1) white light and (2) UV light. Fluorescence from WBPLP-MNPs and BPLP-MNPs was observed in UV light only. (C) Photomicrographs of fluorescence observed from (1) WBPLP-MNPs and (2) BPLP-MNPs under an enhanced optical microscope at 400× magnification.
