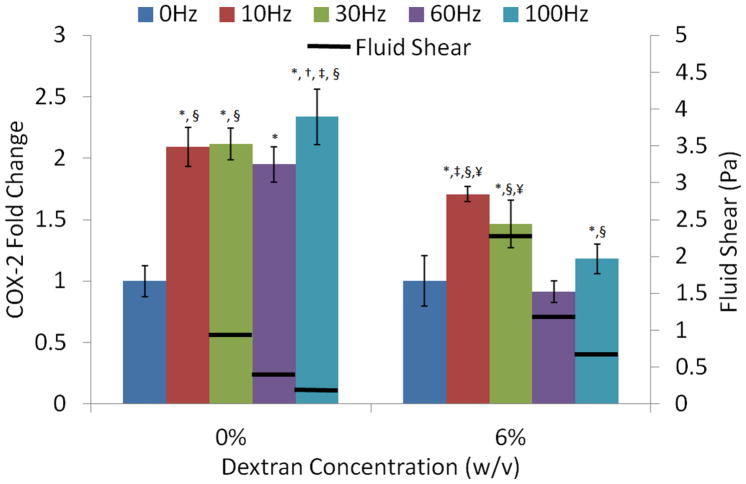
Figure 7. Change in COX-2 expression of MC3T3-E1 cells exposed to five different frequencies under low-shear (0% dextran) and high-shear (6% dextran) conditions.
Fluid shear for each frequency is represented by horizontal black bars. Shear at 10Hz could not be quantified because of resonance behavior of the fluid at this frequency. P<0.05: * against 0Hz, † against10Hz, ‡ against 30Hz, § against 60Hz, ¥ against 100Hz.

