Abstract
While enormous efforts have gone into identifying signaling pathways and molecules involved in normal and malignant cell behaviors1-2, much of this work has been done using classical two-dimensional cell culture models, which allow for easy cell manipulation. It has become clear that intracellular signaling pathways are affected by extracellular forces, including dimensionality and cell surface tension3-4. Multiple approaches have been taken to develop three-dimensional models that more accurately represent biologic tissue architecture3. While these models incorporate multi-dimensionality and architectural stresses, study of the consequent effects on cells is less facile than in two-dimensional tissue culture due to the limitations of the models and the difficulty in extracting cells for subsequent analysis.
The important role of the microenvironment around tumors in tumorigenesis and tumor behavior is becoming increasingly recognized4. Tumor stroma is composed of multiple cell types and extracellular molecules. During tumor development there are bidirectional signals between tumor cells and stromal cells5. Although some factors participating in tumor-stroma co-evolution have been identified, there is still a need to develop simple techniques to systematically identify and study the full array of these signals6. Fibroblasts are the most abundant cell type in normal or tumor-associated stromal tissues, and contribute to deposition and maintenance of basement membrane and paracrine growth factors7.
Many groups have used three dimensional culture systems to study the role of fibroblasts on various cellular functions, including tumor response to therapies, recruitment of immune cells, signaling molecules, proliferation, apoptosis, angiogenesis, and invasion8-15. We have optimized a simple method for assessing the effects of mammary fibroblasts on mammary epithelial cells using a commercially available extracellular matrix model to create three-dimensional cultures of mixed cell populations (co-cultures)16-22. With continued co-culture the cells form spheroids with the fibroblasts clustering in the interior and the epithelial cells largely on the exterior of the spheroids and forming multi-cellular projections into the matrix. Manipulation of the fibroblasts that leads to altered epithelial cell invasiveness can be readily quantified by changes in numbers and length of epithelial projections23. Furthermore, we have devised a method for isolating epithelial cells out of three-dimensional co-culture that facilitates analysis of the effects of fibroblast exposure on epithelial behavior. We have found that the effects of co-culture persist for weeks after epithelial cell isolation, permitting ample time to perform multiple assays. This method is adaptable to cells of varying malignant potential and requires no specialized equipment. This technique allows for rapid evaluation of in vitro cell models under multiple conditions, and the corresponding results can be compared to in vivo animal tissue models as well as human tissue samples.
Keywords: Molecular Biology, Issue 62, Tumor microenvironment, extracellular matrix, three-dimensional, co-culture, spheroid, mixed-cell, cell culture
Protocol
1. Establishing Three-dimensional Co-cultures
The day before establishing the co-cultures, remove the Matrigel from the freezer and thaw on ice in a 4 °C refrigerator overnight.
On the day of the experiment, prepare the medium for co-culture, which corresponds to the medium for the epithelial cells to be used (HMEC medium in this example: DME/F12 medium with 10% bovine calf serum, 5 μg/mL insulin, 1 μg/mL hydrocortisone, and 1 ng/mL EGF). Keep the medium on ice at least 1 hour prior to mixing with Matrigel.
To dilute the thawed Matrigel, determine the total desired quantity of Matrigel:medium (300 μL per well for 24-well plates) and add half that volume of ice-cold HMEC medium to a sterile tube on ice. Then add the same half-total volume of thawed Matrigel to the tube to achieve a 1:1 dilution. Keep the tube on ice.
Place 50 μL of Matrigel:medium mixture mid-well in designated wells of a 24-well plate and incubate for 10 min in a 37 °C incubator with humidified air and 5% CO2.
Add an additional 450 μL of Matrigel:medium mixture to the wells and incubate for another 60 minutes.
During the incubation, prepare a 1:1 suspension of fibroblasts (here h-TERT-immortalized Reduction Mammary Fibroblasts expressing GFP) and epithelial cells (here h-TERT-immortalized Human Mammary Epithelial Cell line expressing RFP) at a concentration of 0.5 x 10⁵ cells each in 0.5 ml of HMEC medium.
After the 60-minute incubation step, gently drop the cell suspension onto the top of the solidified gel, and return culture to the incubator.
Do not disturb the cultures for 2 days. After this, medium can be changed every 2-3 days by very gently aspirating medium from the side of the well and gently replacing with fresh HMEC medium.
Monitor spheroid formation daily under microscopy. Cultures are generally mature after 10-14 days. Image as appropriate using light or fluorescent microscopy. Spheroid size and projection length can be measured under light microscopy.
2. Isolation of Cells from Spheroid Co-cultures
Very gently, pipette the culture up and down 10x using a sterile 2-mL glass pipette. Alternatively, cut off the tip of a 1000 microliter plastic pipette tip using scissors sterilized by autoclaving or immersion in 70% ethanol in order to pipette the culture. Transfer the culture with either the glass pipette or the cut plastic pipette tip to a sterile 15 ml centrifuge tube and centrifuge for 5 min at 2000 rpm at room temperature. The cellular spheroids will sediment at the bottom.
Use a sterile Pasteur pipette tip to gently remove the disrupted Matrigel from the top of the centrifuged tube.
Add 1 ml HMEC medium to the pelleted spheroids, pipette up and down 2-3 times with a sterile 2 mL glass pipette, and transfer the culture to a well in a 24-well tissue culture plate.
Allow the spheroids to attach to the dish for at least 48 hours prior to changing the medium. Over time the cells will leave the spheroidal structures and grow as monolayers.
Passage the cell cultures when cells reach 50% confluence. First expand the culture to a 35 mm dish (approximately 2-4 days), and then to a 100 mm dish (approximately 3-5 days). Immediately prior to each passage step, use a sterile Pasteur pipette to manually remove as many residual "ghost spheroids" as possible.
Analyze cells by flow cytometry for population purity using appropriate cell surface markers and further separate different cell populations by fluorescence cell sorting if necessary. The isolated cells are now ready for further analysis as desired.
3. Representative Results
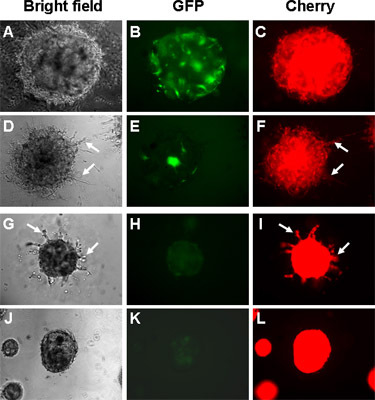
In three-dimensional spheroid co-cultures, fibroblasts with engineered Tiam1 silencing induce increased invasion into matrix by mammary epithelial cells (Figure 1, compare D, E, F to A, B, C). Fibroblasts with engineered over-expression of Tiam1 induce decreased matrix invasion by the breast cancer cell line SUM159 (Figure 1, compare J, K, L to G, H, I).
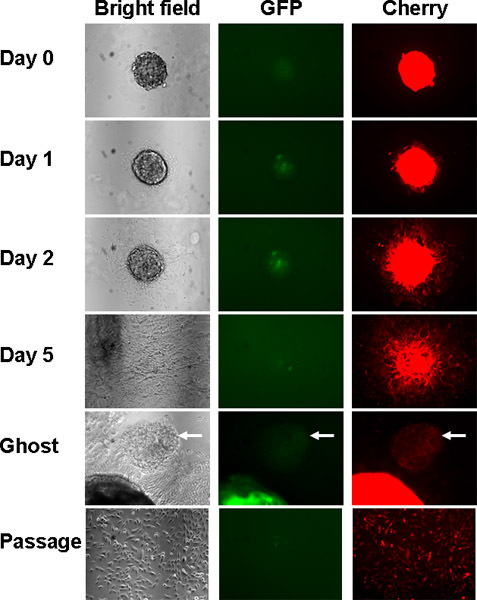
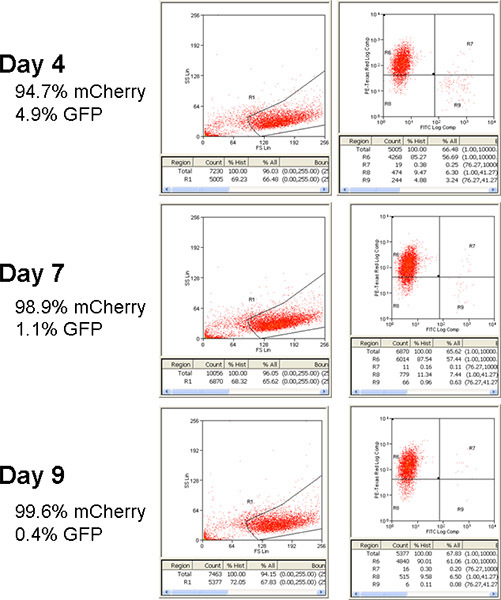
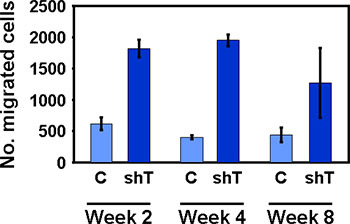
Once co-cultured spheroids have been established, cell populations can be isolated from spheroids by re-plating in a two-dimensional context, as shown in Figure 2. Depending on the relative growth rates of the cells tested, pure populations may emerge through serial passage (as shown in Figure 3) or can be sorted using appropriate cell markers. After isolation from 3D co-culture, epithelial cells retain the properties conferred by co-culture with fibroblasts over extended periods of time, allowing ample opportunity for analysis. In this example, exposure to Tiam1-deficient fibroblasts induced increased migration in co-cultured HMECs that persisted for weeks after isolation from 3D co-culture (Figure 4).
 Figure 1. Imaging of established spheroid co-cultures under light and fluorescence microscopy. Spheroid cultures are established with mammary epithelial and fibroblast cell lines and allowed to grow in culture for 10-14 days. A-F: epithelial = HMEC-mCherry cells. G-L: epithelial cells = SUM159-mCherry cells. A-C, G-I: fibroblast = control RMF-GFP cells. D-F: fibroblast = RMF-GFP with Tiam1 silencing. J-L: fibroblast = RMF-GFP with Tiam1 over-expression. Arrows indicate epithelial projections invading into matrix.
 Figure 2. Serial imaging of cultures under light and fluorescence microscopy after isolation from Matrigel culture. Day 0 represents imaging immediately after isolation; days 1, 2 and 5 indicate days after isolation. The corona of cells leaving the spheroid increases over time. Eventually a "ghost" spheroid with very few cells remains (arrow). Very few spheroids remain after ghost removal and first passage.
 Figure 3. Flow cytometry analysis of cells after isolation from Matrigel co-culture. After spheroid co-cultures have matured, cells are isolated from the 3D co-culture with pipetting and serial passaging. Sample aliquots are analyzed by flow cytometry (in this example using green fluorescence and red fluorescence to identify GFP-expressing fibroblasts and mCherry-expressing epithelial cells respectively) to determine relative populations of epithelial and fibroblast cells.
 Figure 4. Transwell migration of HMECs persists after isolation from Matrigel co-culture. Once pure populations have been obtained through culture or fluorescence cell sorting, cells can be analyzed as desired. Here migration of HMECs co-cultured with either control (C) or Tiam1 deficient (shT) fibroblasts across perforated transwells was assessed at 2, 4 and 8 weeks after isolation from co-culture.
Discussion
The method presented here represents a simple approach to analyzing the effects of stromal fibroblasts on epithelial cells, including tumor cells. It allows for direct cell-cell interaction within a three-dimensional context supported by extracellular basement membrane matrix, while enabling easy extraction of cells from the matrix for further analysis. This can be applied to the study of tumor-associated stroma, as fibroblast lines can be manipulated to affect signaling pathways of choice and epithelial lines can vary in invasive potential, as shown in Figure 1. The 3D co-culture model allows for visual verification that changes in cell invasiveness have been induced. The isolation protocol allows for extraction of cells from the 3D cultures with a minimum of handling and avoids the use of trypsin or matrix-dissolving agents that might affect cell properties. The effects of exposure to fibroblast in 3D co-culture persist in epithelial cells after isolation from 3D co-culture, facilitating subsequent analysis (Figure 4). While the example shown here depicts effects on cell migration, any assay applicable to cells growing in 2D can be used on the isolated cells. We have used this method to analyze the effects of varying fibroblast Tiam1 expression on the behavior of associated mammary epithelial cells. Tiam1 deficiency in fibroblasts promotes mammary tumor cell invasion and metastasis in 3D culture and animal tumor models23. This method has enabled us to analyze potential involved pathways using molecular, biochemical, and functional assays (Liu and Buchsbaum, in press).
It is important to use only cell lines in excellent health and to adhere to rigorous sterile technique in order to prevent contamination of cultures during the process. The best results are obtained using cells from early rather than late passages (precise passage number will vary depending on the specific cell line) and from cells harvested at densities between 50-80% confluence. Precise handling of Matrigel according to protocol is key in order to facilitate both complete liquification prior to establishing the co-cultures and to ensure thorough solidification of the matrix before addition of the cells. Inadequate amount or solidification of the matrix will result in cells growing as a monolayer rather than in spheroids in the cultures. When first establishing the spheroid co-cultures, the placement of an initial 50 μl plug in the well allows for solid anchoring and more uniform solidification of the final matrix, which is key to evenly distributed spheroid formation. Removal of all ghost spheroids at post-isolation passage steps is critical if automated cell sorting is to be used to separate mixed populations. The examples shown here use phenol-red free Matrigel with protein composition of approximately 10 mg/ml. The phenol-red free preparation allows for color detection in assays, such as fluorescence.
This technique can be applied to a range of cell types in order to study the effects of stromal fibroblasts on associated epithelial cell tumors or conversely the effects of tumor cells on associated fibroblasts. This technique allows for rapid evaluation of in vitro cell models under multiple conditions, and the corresponding results can then be compared to in vivo animal tissue models as well as human tissue samples.
Disclosures
No conflicts of interest declared.
References
- Hanahan D, Weinberg RA. The hallmarks of cancer. Cell. 2000;100:57–70. doi: 10.1016/s0092-8674(00)81683-9. [DOI] [PubMed] [Google Scholar]
- Hanahan D, Weinberg RA. Hallmarks of cancer: the next generation. Cell. 2011;144:646–674. doi: 10.1016/j.cell.2011.02.013. [DOI] [PubMed] [Google Scholar]
- Kim JB. Three-dimensional tissue culture models in cancer biology. Semin. Cancer Biol. 2005;15:365–377. doi: 10.1016/j.semcancer.2005.05.002. [DOI] [PubMed] [Google Scholar]
- Li H, Fan X, Houghton J. Tumor microenvironment: the role of the tumor stroma in cancer. J. Cell Biochem. 2007;101:805–815. doi: 10.1002/jcb.21159. [DOI] [PubMed] [Google Scholar]
- Tse JC, Kalluri R. Mechanisms of metastasis: epithelial-to-mesenchymal transition and contribution of tumor microenvironment. J. Cell Biochem. 2007;101:816–829. doi: 10.1002/jcb.21215. [DOI] [PubMed] [Google Scholar]
- Bhowmick NA. TGF-beta signaling in fibroblasts modulates the oncogenic potential of adjacent epithelia. Science. 2004;303:848–851. doi: 10.1126/science.1090922. [DOI] [PubMed] [Google Scholar]
- Bhowmick NA, Moses HL. Tumor-stroma interactions. Curr. Opin. Genet. Dev. 2005;15:97–101. doi: 10.1016/j.gde.2004.12.003. [DOI] [PMC free article] [PubMed] [Google Scholar]
- Havlickova B, Biro T, Mescalchin A, Arenberger P, Paus R. Towards optimization of an organotypic assay system that imitates human hair follicle-like epithelial-mesenchymal interactions. Br. J. Dermatol. 2004;151:753–765. doi: 10.1111/j.1365-2133.2004.06184.x. [DOI] [PubMed] [Google Scholar]
- Kilani RT. Selective cytotoxicity of gemcitabine in bladder cancer cell lines. Anticancer Drugs. 2002;13:557–566. doi: 10.1097/00001813-200207000-00002. [DOI] [PubMed] [Google Scholar]
- Seidl P, Huettinger R, Knuechel R, Kunz-Schughart LA. Three-dimensional fibroblast-tumor cell interaction causes downregulation of RACK1 mRNA expression in breast cancer cells in vitro. Int. J. Cancer. 2002;102:129–136. doi: 10.1002/ijc.10675. [DOI] [PubMed] [Google Scholar]
- Silzle T. Tumor-associated fibroblasts recruit blood monocytes into tumor tissue. Eur. J. Immunol. 2003;33:1311–1320. doi: 10.1002/eji.200323057. [DOI] [PubMed] [Google Scholar]
- Bartling B, Demling N, Silber RE, Simm A. Proliferative stimulus of lung fibroblasts on lung cancer cells is impaired by the receptor for advanced glycation end-products. Am. J. Respir. Cell Mol. Biol. 2006;34:83–91. doi: 10.1165/rcmb.2005-0194OC. [DOI] [PubMed] [Google Scholar]
- Kunz-Schughart LA. Potential of fibroblasts to regulate the formation of three-dimensional vessel-like structures from endothelial cells in vitro. Am. J. Physiol. Cell Physiol. 2006;290:C1385–C1398. doi: 10.1152/ajpcell.00248.2005. [DOI] [PubMed] [Google Scholar]
- Liu T, Lin B, Qin J. Carcinoma-associated fibroblasts promoted tumor spheroid invasion on a microfluidic 3D co-culture device. Lab Chip. 2010;10:1671–1677. doi: 10.1039/c000022a. [DOI] [PubMed] [Google Scholar]
- Zengel P. Multimodal therapy for synergic inhibition of tumour cell invasion and tumour-induced angiogenesis. BMC Cancer. 2010;10:92–92. doi: 10.1186/1471-2407-10-92. [DOI] [PMC free article] [PubMed] [Google Scholar]
- Kunz-Schughart LA, Heyder P, Schroeder J, Knuechel R. A heterologous 3-D coculture model of breast tumor cells and fibroblasts to study tumor-associated fibroblast differentiation. Exp. Cell Res. 2001;266:74–86. doi: 10.1006/excr.2001.5210. [DOI] [PubMed] [Google Scholar]
- Djordjevic B, Lange CS. Cell-cell interactions in spheroids maintained in suspension. Acta Oncol. 2006;45:412–420. doi: 10.1080/02841860500520743. [DOI] [PubMed] [Google Scholar]
- Hirschhaeuser F. Multicellular tumor spheroids: an underestimated tool is catching up again. J. Biotechnol. 2010;148:3–15. doi: 10.1016/j.jbiotec.2010.01.012. [DOI] [PubMed] [Google Scholar]
- Hoevel T, Macek R, Swisshelm K, Kubbies M. Reexpression of the TJ protein CLDN1 induces apoptosis in breast tumor spheroids. Int. J. Cancer. 2004;108:374–383. doi: 10.1002/ijc.11571. [DOI] [PubMed] [Google Scholar]
- Paduch R, Kandefer-Szerszen M. Vitamin D, tamoxifen and beta-estradiol modulate breast cancer cell growth and interleukin-6 and metalloproteinase-2 production in three-dimensional co-cultures of tumor cell spheroids with endothelium. Cell. Biol. Toxicol. 2005;21:247–256. doi: 10.1007/s10565-005-0002-z. [DOI] [PubMed] [Google Scholar]
- Timmins NE, Nielsen LK. Generation of multicellular tumor spheroids by the hanging-drop method. Methods Mol. Med. 2007;140:141–151. doi: 10.1007/978-1-59745-443-8_8. [DOI] [PubMed] [Google Scholar]
- Foty R. A Simple Hanging Drop Cell Culture Protocol for Generation of 3D Spheroids. J. Vis. Exp. 2011. pp. e2720–e2720. [DOI] [PMC free article] [PubMed]
- Xu K. The role of fibroblast Tiam1 in tumor cell invasion and metastasis. Oncogene. 2010;29:6533–6542. doi: 10.1038/onc.2010.385. [DOI] [PMC free article] [PubMed] [Google Scholar]


