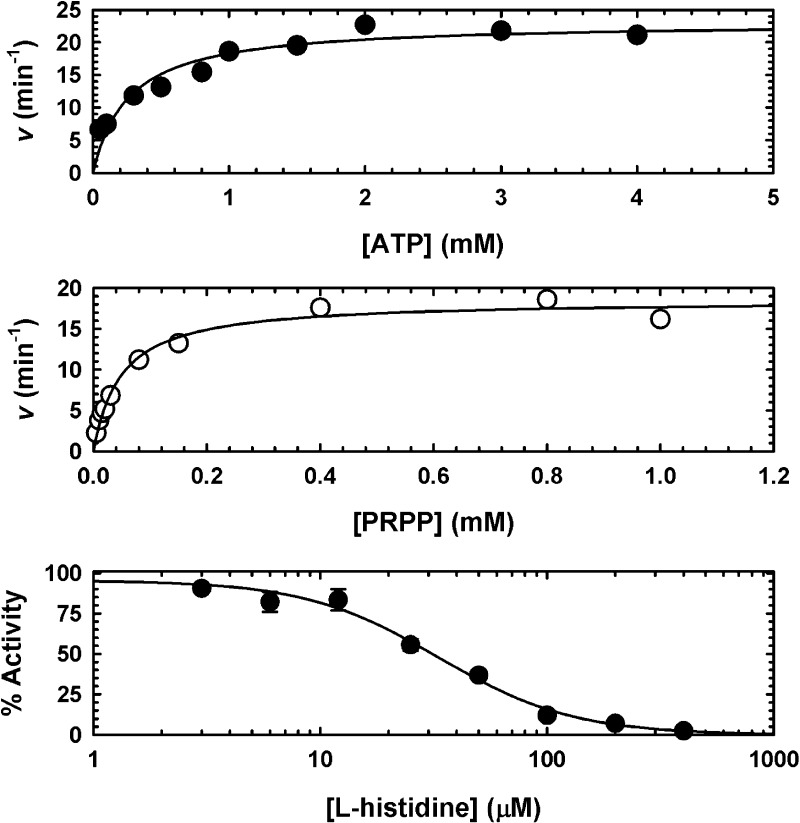
Figure 2.
Steady-state kinetics of MtATP-PRT and its inhibition by l-histidine. The top and middle panels show the saturation curves for ATP (●) and PRPP (○), respectively. These experiments were performed at 25 °C, in 50 mM Tris-HCl (pH 8.5) containing 7 mM MgCl2 and 200 mM KCl. When the ATP concentration was varied, the PRPP concentration was 0.8 mM. When the PRPP concentration was varied, the ATP concentration was 1.6 mM. The bottom panel shows the inhibition (at a single substrate concentration) of MtATP-PRT by l-histidine (●). This experiment was performed at 25 °C, in 50 mM Tris-HCl (pH 8.5) containing 7 mM MgCl2, 200 mM KCl, 1.6 mM ATP, and 0.8 mM PRPP. Points are data and lines best fit to eq 1 (top and middle panels) and eq 2 (bottom panel). Results are representative of two independent experiments.

