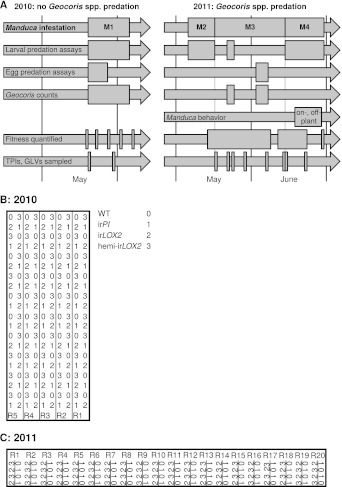
Figure 4.
Experimental timeline and layout. (A) Timeline of field experiments in 2010 and 2011. Different assays and measurements are represented by individual arrows, and rectangles span the time frame of each assay or measurement; narrow rectangles represent single days. Four experimental Manduca infestations (M1–M4) structure the overall experimental design: M1–M3, with laboratory Manduca, and M4, with wild Manduca larvae. (B and C) Layouts of field plots in (B) 2010 and (C) 2011. Thick lines denote the borders of the experiment, thin lines denote irrigation lines (vertical borders of plot were also irrigation lines in [B] 2010), and R# denotes row number (used for identifying replicates during the experiment). The genotype key in (B) applies to both (B) and (C).

