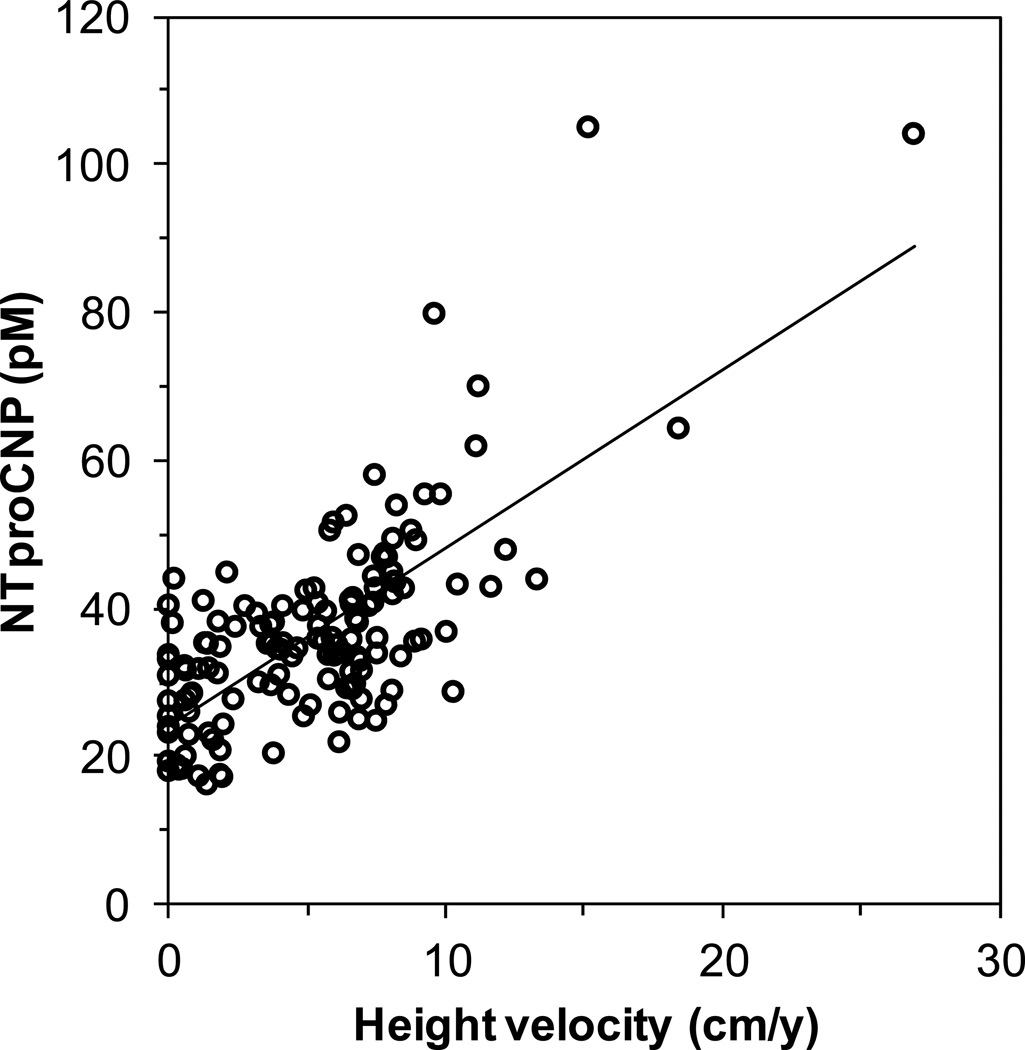
Figure 3.
Correlation between height velocity and NTproCNP levels. Plasma for NTproCNP was taken at the first visit. Annualized height velocity was determined using the height at the first visit and a follow up height taken between 2 and 12 months later. Line, least mean squares linear regression line. The correlation is significant (n=139, r=0.711, p<0.0005).

