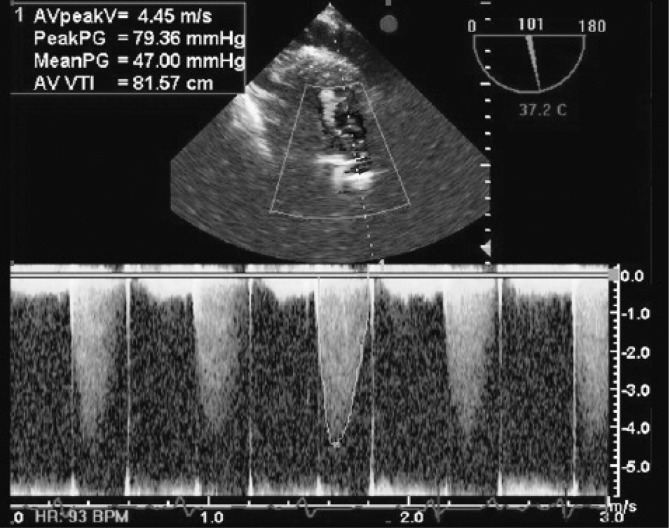
Figure 1.
Deep transgastric view of an obstructed aortic prosthesis. Continuous Doppler echocardiography showed significant increase in peak and mean pressure gradient through the aortic prosthesis
AV peak V, Aortic valve peak velocity; Peak PG, Peak pressure gradient; Mean PG, Mean pressure gradient; AV VTI, Aortic valve velocity time integral

