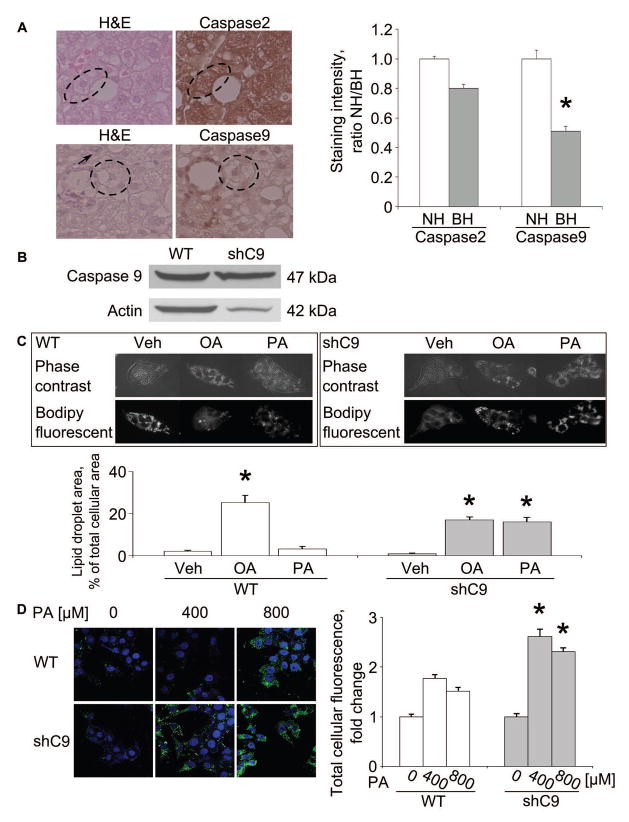
Figure 1. Ballooned hepatocytes display decreased caspase 9 in NASH specimens; loss of caspase 9 or 3 enhances lipid loading in vitro.
(A) Ballooned hepatocytes (BH) and nonballoned hepatocytes (NH, arrow) were identified in H&E stained sections (circled cells). Immunohistochemistry for caspase 2 and 9 was performed in sections from the same specimens. Caspase 2 and 9 staining intensity was quantified by NIH Image J software (right panel). (B) Whole cell lysates were prepared from wild type (WT) and shC9 cells and immunoblot analysis performed for caspase 9. (C) WT and shC9 cells were incubated with vehicle (Veh), palmitate (PA) or oleate (OA) at 400 μM for 12 hours. Lipid droplets were labeled with Bodipy 505/515, and cells imaged by phase contrast microscopy and fluorescent microscopy. Lipid droplet area and total cell area were measured by NIH Image J software. (D) WT and shC9 cells were incubated with PA for 12 hours at 0, 400, or 800 μM, respectively, labeled with Bodipy 505/515, and imaged by confocal microscopy. Fluorescence intensity was quantified using Metafluor quantitative software and expressed as fold change over vehicle. All data are expressed as mean ± SEM for at least three experiments; *p<0.01.

