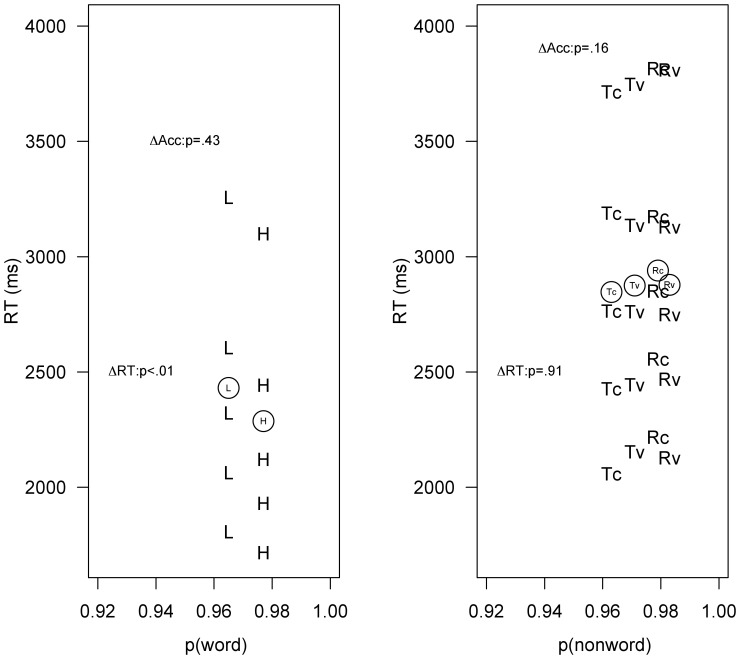
Figure 1. The figure shows the accuracy (in x-axis) and the RTs at the.1,.3,.5,.7 and.9 vincentiles for correct responses to words (H: high frequency, L: low frequency) and pseudowords (Rc: replacement-letter consonant, Tc: transposed-letter consonant; Rv: replacement-letter vowel, Tv: transposed-letter vowel).
The circles represent the means of each condition.

