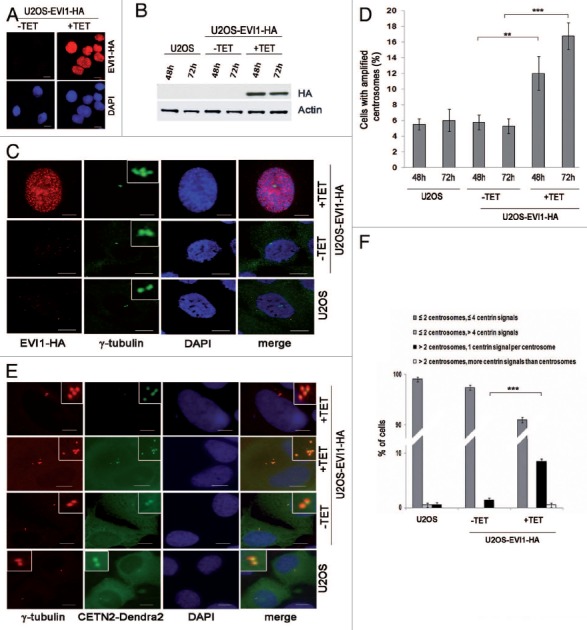
Figure 1. Overexpression of EVI1 leads to centrosomal aberrations. (A) In U2OS cells conditionally overexpressing EVI1-HA, transgene expression was induced for 72 h. Cells were immunostained for HA (red). DNA was counterstained with DAPI (blue). Scale bars represent 10 μm. (B) Overexpression of EVI1-HA was induced for 48 or 72 h, followed by immunoblotting for EVI1-HA or the loading control actin using 50 µg of protein extract from parental U2OS cells, uninduced (-TET) and induced (+TET) U2OS cells conditionally overexpressing EVI1-HA. (C) In U2OS cells conditionally overexpressing EVI1-HA, transgene expression was induced for 72 h. Parental U2OS cells, uninduced (-TET) and induced (+TET) U2OS cells conditionally overexpressing EVI1-HA were immunostained for γ-tubulin (green) and EVI1-HA (red). DNA was counterstained with DAPI (blue). Scale bars represent 10 μm. Insets show centrosomes at higher magnification. (D) U2OS cells conditionally overexpressing EVI1-HA were left untreated (-TET) or induced to express the transgene for 48 or 72 h (+TET). Parental U2OS cells were grown in parallel. Following immunostaining as in (C), percentages of cells with more than two centrosomes were quantified in 4 × 100 cells per data bar. ***, this difference is highly significant (p = 0.00011). **, this difference is significant (p = 0.0055). (E) U2OS cells conditionally overexpressing EVI1-HA and parental U2OS cells were transfected with CETN2-Dendra2 (green). Twenty-four h later, transgene expression was induced where indicated (+TET). Cells were harvested 72 h after transgene induction and immunostained for γ-tubulin (red). DNA was counterstained with DAPI (blue). Scale bars represent 10 μm. Insets show centrosomes at higher magnification. (F) The observations shown in (E) were quantified by evaluating 3 × 50 transfected cells per data bar, which were categorized as specified in the figure. ***, this difference is highly significant (p = 0.00097).
