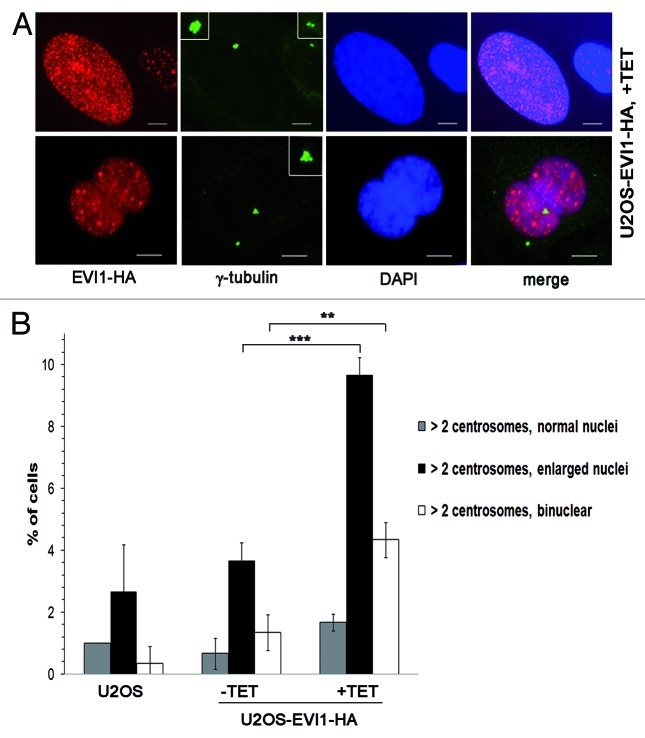
Figure 2. EVI1-overexpressing cells show abnormal nuclei. (A) In U2OS cells conditionally overexpressing EVI1-HA, transgene expression was induced for 72 h. Cells were immunostained for γ-tubulin (green) and EVI1-HA (red). DNA was counterstained with DAPI (blue). Scale bars represent 10 μm. Insets show centrosomes at higher magnification. (B) U2OS cells conditionally overexpressing EVI1-HA were left untreated (-TET) or induced to express the transgene for 72 h (+TET). Parental U2OS cells were grown in parallel. Following immunostaining as in (A), percentages of cells with more than two centrosomes and the nuclear morphology detailed in the figure were quantified in 3 × 100 cells per data bar. ***, this difference is highly significant (p = 0.00021). **, this difference is significant (p = 0.00312).

An official website of the United States government
Here's how you know
Official websites use .gov
A
.gov website belongs to an official
government organization in the United States.
Secure .gov websites use HTTPS
A lock (
) or https:// means you've safely
connected to the .gov website. Share sensitive
information only on official, secure websites.
