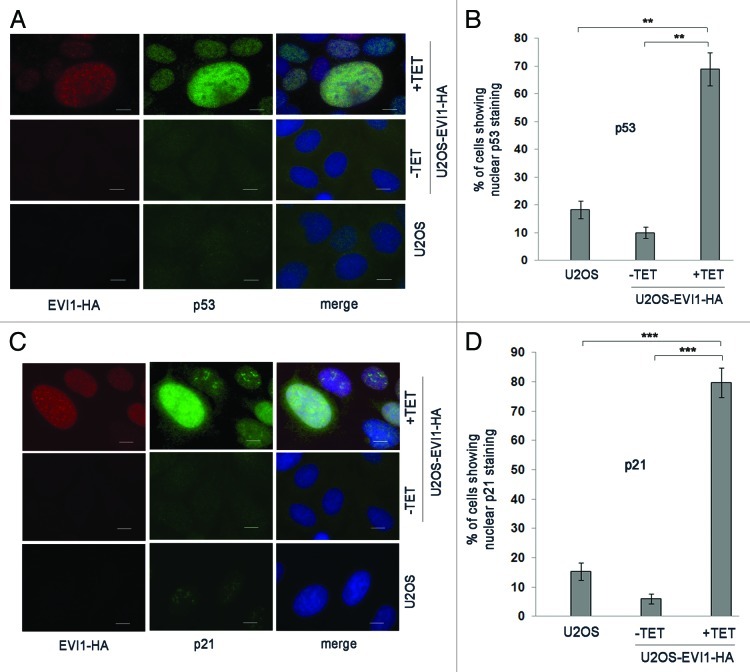
Figure 5. EVI1 overexpression induces activation of the p53 pathway. (A) Parental U2OS cells, uninduced (-TET) and induced (+TET) U2OS cells conditionally overexpressing EVI1-HA were harvested 72 h after induction of transgene expression and immunostained for HA (red) and p53 (green). DNA was counterstained with DAPI (blue). Scale bars represent 10 µm. (B) The observations shown in (A) were quantified by counting cells displaying nuclear positivity for p53. Results are given as mean ± SD of 3 × 100 cells per data bar. **, these differences are significant (p = 0.0015 and p = 0.0010 for the comparison with uninduced EVI1-HA and parental U2OS cells, respectively). (C) Parental U2OS cells, uninduced (-TET) and induced (+TET) U2OS cells conditionally overexpressing EVI1-HA were harvested 72 h after induction of transgene expression and immunostained for HA (red) and p21 (green). DNA was counterstained with DAPI (blue). Scale bars represent 10 µm. (D) The observations shown in (C) were quantified by counting cells displaying nuclear positivity for p21. Results are given as mean ± SD of 3 × 100 cells per data bar. ***, these differences are highly significant (p = 0.00055 and p = 0.00018 for the comparison with uninduced EVI1-HA and parental U2OS cells, respectively).

An official website of the United States government
Here's how you know
Official websites use .gov
A
.gov website belongs to an official
government organization in the United States.
Secure .gov websites use HTTPS
A lock (
) or https:// means you've safely
connected to the .gov website. Share sensitive
information only on official, secure websites.
