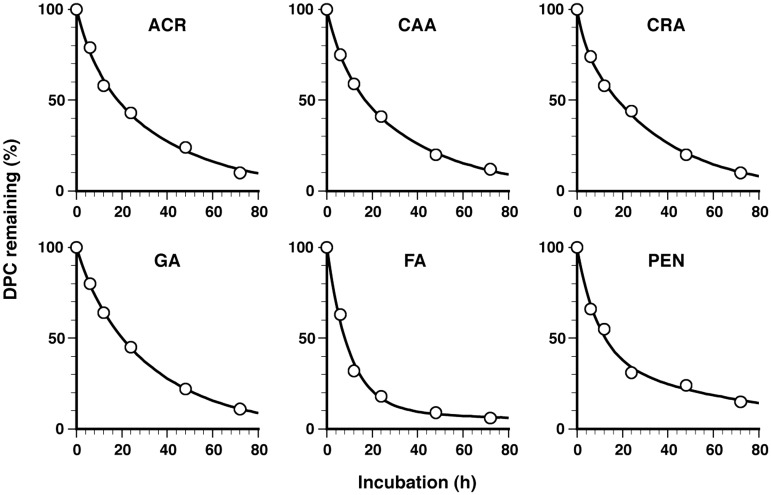
Figure 4.
In vitro kinetics of the elimination of aldehyde-induced DPCs. DNA isolated from cells immediately after aldehyde treatment (LD10) was labeled with FITC and incubated in TE buffer (pH 7.4) at 37°C, with dialysis against the same buffer (molecular cut-off = 100 kDa) to separate the proteins released from DNA. The remaining DPCs were quantified by measuring the fluorescence of the sample inside the dialysis tube. The percentage of remaining DPCs for the indicated aldehydes is plotted against the incubation time. Data points are means of two dialysis experiments. Regression curves based on a two-component exponential model are shown by the solid line. The parameters of the regression curves (half-life and initial composition) are listed in Table 2. Note that the rates of loss of DPCs were lower during ultracentrifugation and dialysis at 20 and 4°C, respectively, than the rates measured at 37°C (see ‘Discussion’ section and Supplementary Figure S3 and Supplementary Table S1).

