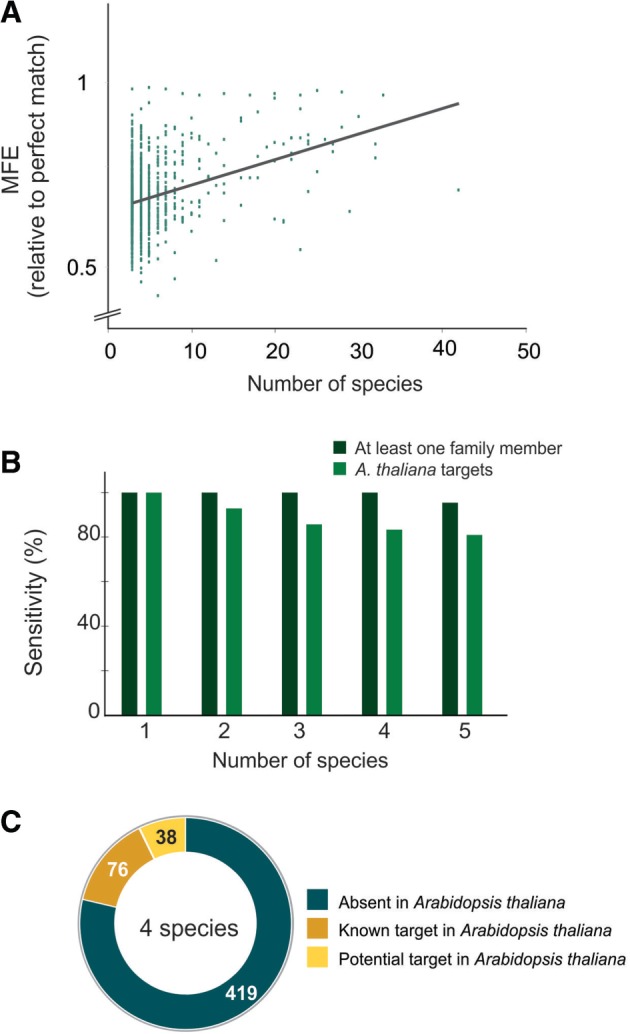
Figure 3.

Selection of miRNA targets by sequence conservation. (A) Relationship between the MFE and the number of species where each target was detected. The MFE represents the average of all cognate target sites. A regression line is indicated. (B) Sensitivity of the approach. The sensitivity was evaluated in two ways, one analyzing the presence of validated targets in Arabidopsis thaliana (light green, described in Supplementary Table S3); and alternatively, it was assayed by the presence of at least one target of each gene family regulated by miRNAs (dark green). (C) Classification of the potential targets present in at least four species.
