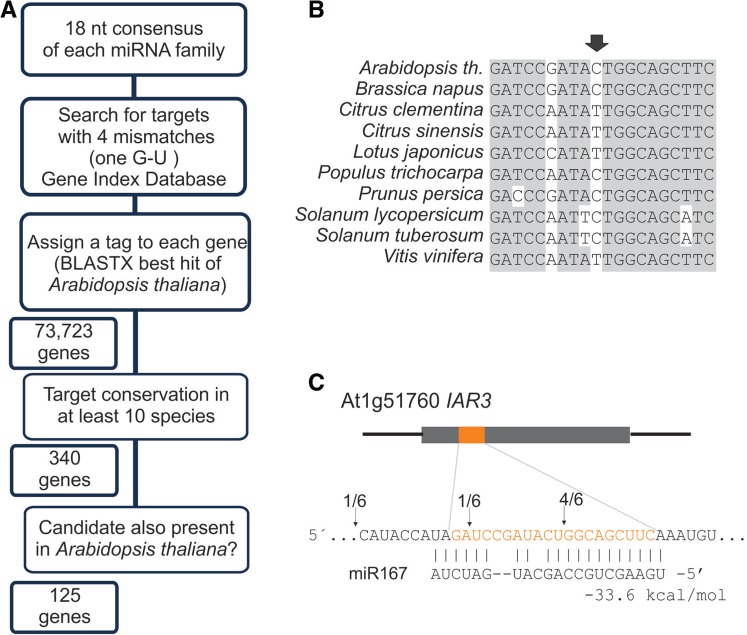
Figure 5.
Identification of a new target by relaxation of the interaction parameters while increasing the conservation parameter. (A) Scheme showing the strategy to identify the miRNA targets. (B) Conservation of the target site in different species. The arrow indicates a position of a G-C or G-U interaction with the miRNA depending on the species. (C) Alignment of Arabidopsis IAR3 and miR167. The position that contains a G-U wobble is indicated. The arrows show the position of cleavage sites as determined by 5′ RACE-PCR, and the numbers indicate the cloning frequency of each fragment (21).

