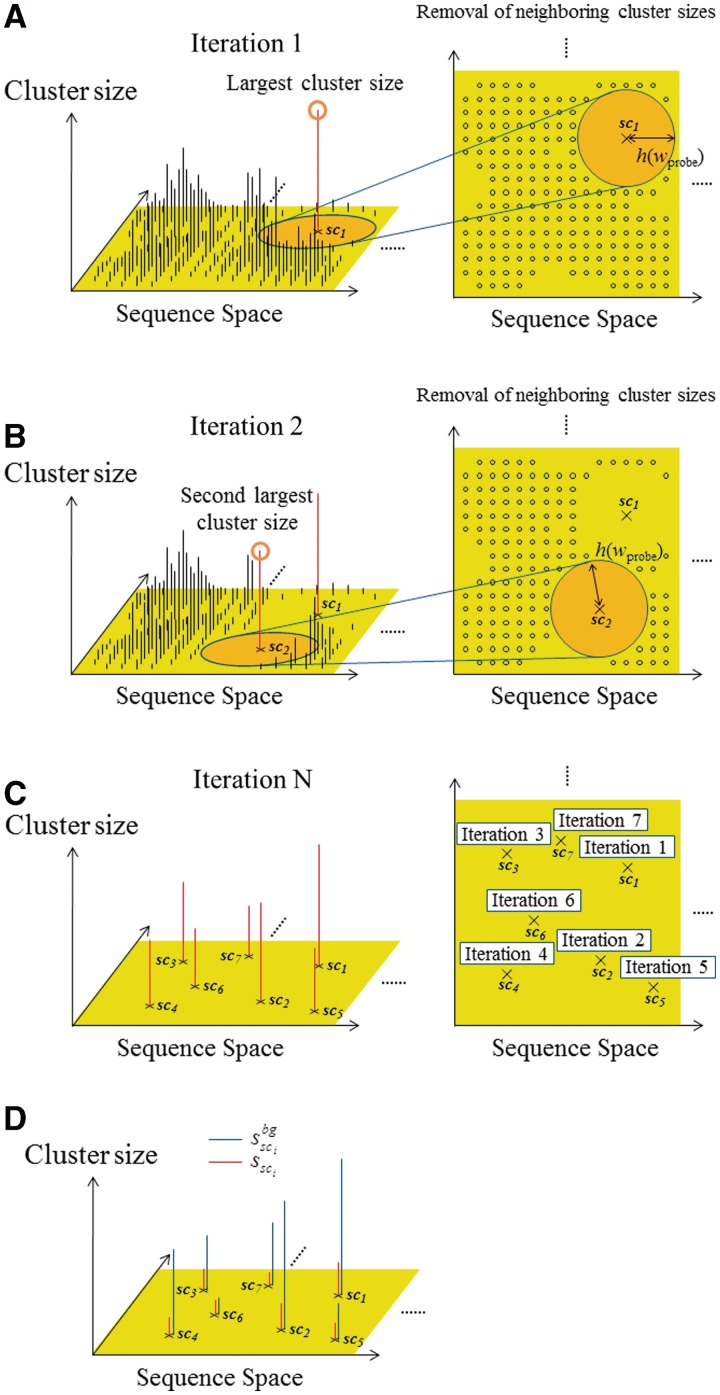
Figure 3.
Schematic diagram of the selection scheme of the ‘distinguishable’ clusters. (A) In the first iteration, the cluster with the largest size is selected, and then the neighboring sets closed to the largest cluster are removed in the subsequent iteration for the selection. (B) In the second iteration, the cluster with the second largest size is selected, and the neighboring sets closed to the second largest one are removed. Similar iterations are repeated for all of the clusters. (C) Finally, the distinguishable clusters are only left. (D) With respect to each extracted cluster (red), the cluster size calculated from the background data (blue) is also mapped.

