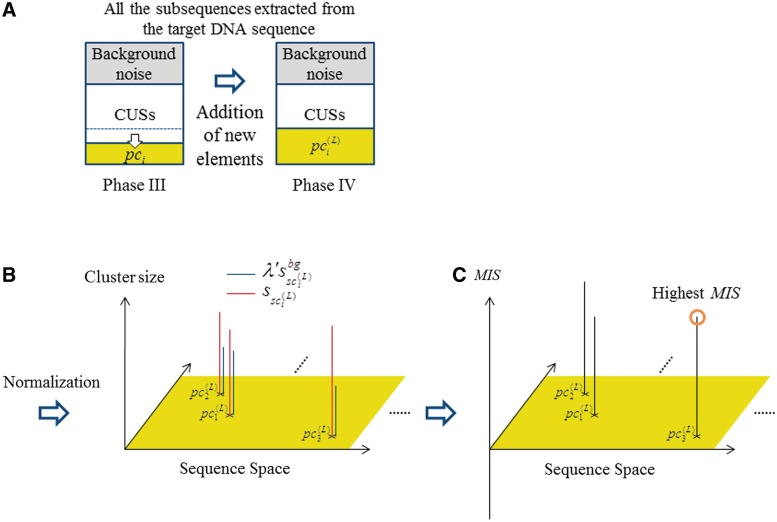
Figure 6.
Schematic diagram of the GI algorithm implemented in the present program. (A) The new subsequences are extracted from the CUSs, and are added to the plausible clusters. (B) With respect to each updated cluster (red), the normalized cluster sizes calculated from the background data are also mapped (blue). (C) The MISs of the updated clusters are plotted. By employing the MISs for the updated clusters, the most plausible cluster is selected.

