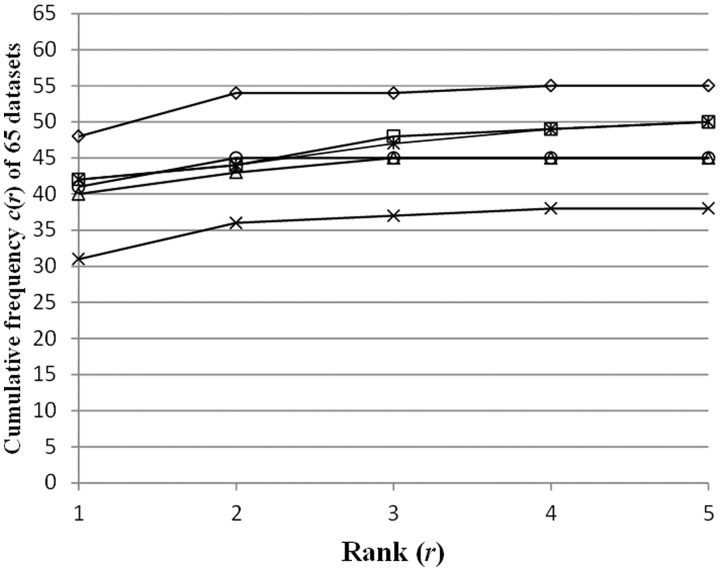
Figure 7.
The cumulative frequency c(r) (r represents ‘Rank’, i.e. r = 1, … , 5) in equation (13) is plotted with respect to the six programs. MDscan (squares) was performed with pre-treatments of each dataset (i.e. the SSR reduction and the rearrangement of the target DNA fragments). DME (asterisks) and Weeder (circles) were performed with the SSR reduction. Our system (rhombuses), BioProspector (triangles) and MEME (crosses) were performed without any pre-treatments. See Supplementary Figures S1–S4, concerning the results performed under other various conditions.

